
The goal of vprr is to process Video Plankton Recorder (VPR) data in R. This package allows for manual image classification, calculation of important ecological metrics such as concentration of plankton, data visualization, and data output with self-contained metadata.
Detailed information about vprr can be found in the package vignette.
You can install the released version of vprr from CRAN with:
install.packages("vprr")And the development version from GitHub with:
# install.packages("devtools")
devtools::install_github("EOGrady21/vprr")vprr is designed to be used after processing VPR data with an automated image classification system. vprr utilizes file formats and directory structures consistent with those from Visual Plankton (VP), a Matlab image classification software designed for VPR datasets; however, vprr is not dependent on any specific elements of VP.
All the technical details of vprr can be found in the package vignette, available through Rstudio or at https://eogrady21.github.io/vprr/ (under Articles).
Figure 1. VPR data processing flow chart. Blue boxes represent software, green and yellow boxes represent data sets, where yellow is visual data and green is text format data. This package represents ‘Processing and Visualization (R)’.
The first element of processing VPR data is to classify the images
collected. This can be done using machine learning techniques and then
checked and manually edited in vprr. vprr uses a GUI, called through
vpr_manual_classification() to allow a user to review and
change image classifications.
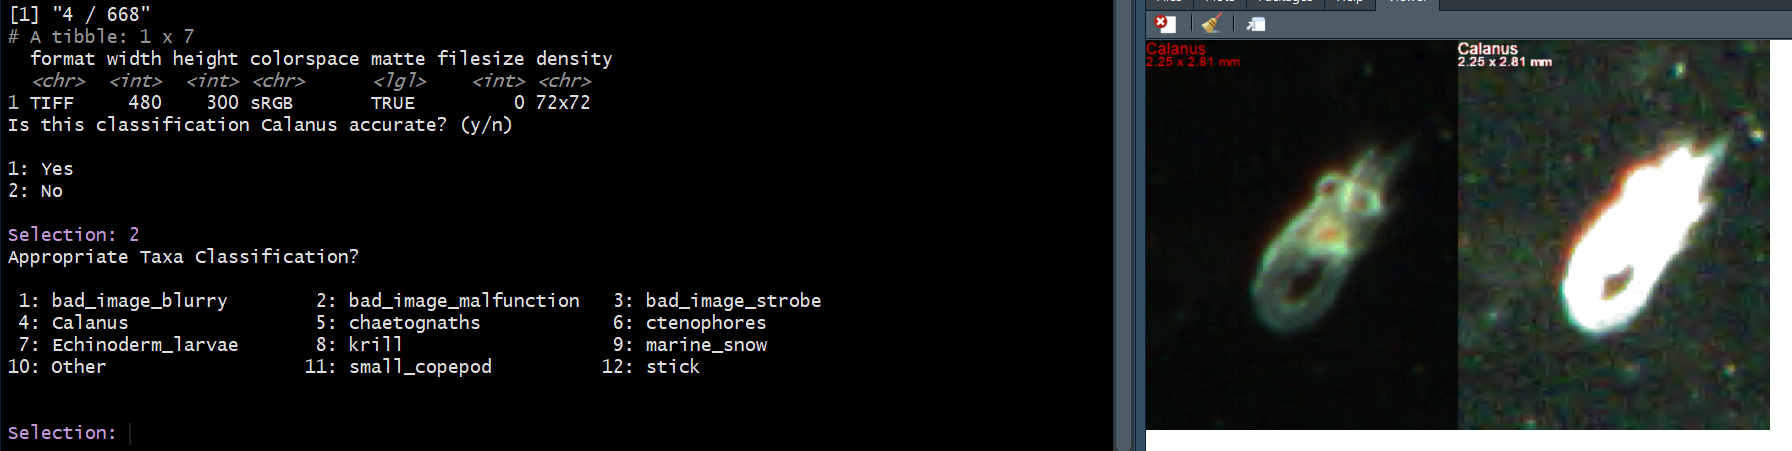
Figure 2. A screenshot from the vprr manual reclassification process. VPR images are displayed in the RStudio Viewer (right), prompts are displayed in the RStudio console (left). Users are asked if classifications are correct, if not, they are asked to select the proper classification from a pre-set list of categories.
Once images have been properly classified, all data sources are
combined, in order to analyze data and calculate metrics such as
plankton concentration. Data from CTD files
(vpr_ctd_read()) and image classification
(vpr_autoid_read()) can be read in and combined into data
frames. vprr can combine VPR CTD, and VPR image classifications into
depth bins, and calculate concentration
(vpr_roi_concentration()).
After data is processed, it can be visualized for easy
interpretation. Although this package does not focus on visualization,
it does provide some basic plotting functions for tow-yo VPR data
(vpr_plot_contour()).
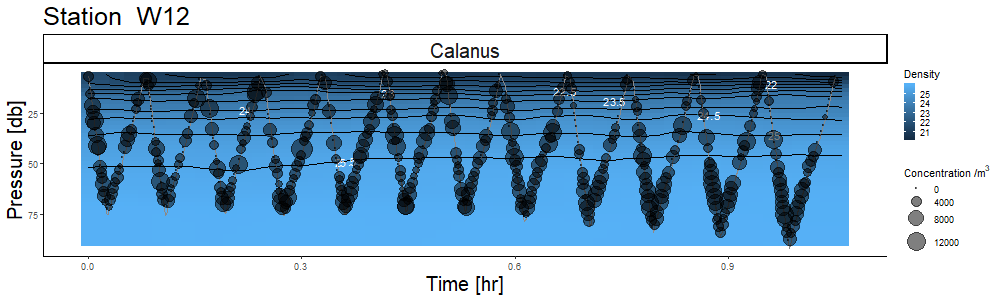
Figure 3. An example of visualization of VPR data showing calculated concentration of Calanus along the VPR tow-yo path, over density contours.