

![]()
![]()


![]()
![]()
![]()
![]()
The goal of tidyterra is to provide methods from tidyverse
packages for SpatRaster and SpatVector objects
created with terra.
It also provides ggplot2 geoms
and scales for plotting those objects.
Please cite tidyterra as:
Hernangómez, D. (2023). Using the tidyverse with terra objects: the tidyterra package. Journal of Open Source Software, 8(91), 5751, https://doi.org/10.21105/joss.05751.
A BibTeX entry for LaTeX users is:
@article{Hernangómez2023,
  doi = {10.21105/joss.05751},
  url = {https://doi.org/10.21105/joss.05751},
  year = {2023},
  publisher = {The Open Journal},
  volume = {8},
  number = {91},
  pages = {5751},
  author = {Diego Hernangómez},
  title = {Using the {tidyverse} with {terra} objects: the {tidyterra} package},
  journal = {Journal of Open Source Software}
}The full manual for the latest release of tidyterra on CRAN is online: https://dieghernan.github.io/tidyterra/
Methods implemented in tidyterra work differently
depending on the type of Spat* object:
SpatVector: Methods are implemented using
terra::as.data.frame() coercion. Rows correspond to
geometries and columns correspond to attributes of each
geometry.
SpatRaster: Methods can be applied to layers or
cells. tidyterra’s overall approach is to treat the
layers as columns of a tibble and the cells as rows. For example,
select(SpatRaster, 1) selects the first layer of a
SpatRaster.
Implemented methods return the same type of object as the input,
unless the method is expected to return another type of object. For
example, as_tibble() returns a tibble.
Current methods and functions provided by tidyterra are:
| tidyverse method | SpatVector |
SpatRaster |
|---|---|---|
tibble::as_tibble() |
✔️ | ✔️ |
dplyr::select() |
✔️ | ✔️ Select layers |
dplyr::mutate() |
✔️ | ✔️ Create or modify layers |
dplyr::transmute() |
✔️ | ✔️ |
dplyr::filter() |
✔️ | ✔️ Modify cell values and optionally remove outer cells. |
dplyr::filter_out() |
✔️ | |
dplyr::slice() |
✔️ | ✔️ Additional methods for slicing by row and column. |
dplyr::pull() |
✔️ | ✔️ |
dplyr::rename() |
✔️ | ✔️ |
dplyr::relocate() |
✔️ | ✔️ |
dplyr::distinct() |
✔️ | |
dplyr::arrange() |
✔️ | |
dplyr::glimpse() |
✔️ | ✔️ |
dplyr::inner_join() family |
✔️ | |
dplyr::nest_join() |
✔️ | |
dplyr::cross_join() |
✔️ | |
dplyr::summarise() |
✔️ | |
dplyr::reframe() |
✔️ | |
dplyr::group_by() family |
✔️ | |
dplyr::rowwise() |
✔️ | |
dplyr::count(), tally() |
✔️ | |
dplyr::add_count() |
✔️ | |
dplyr::rows_*() |
✔️ | |
dplyr::bind_cols() /
dplyr::bind_rows() |
✔️ as bind_spat_cols() /
bind_spat_rows() |
|
tidyr::drop_na() |
✔️ | ✔️ Remove cell values with NA on any layer and outer
cells with NA. |
tidyr::complete() |
✔️ | |
tidyr::expand() |
✔️ | |
tidyr::replace_na() |
✔️ | ✔️ |
tidyr::fill() |
✔️ | |
tidyr::nest() |
✔️ | |
tidyr::pivot_longer() |
✔️ | |
tidyr::pivot_wider() |
✔️ | |
tidyr::uncount() |
✔️ | |
tidyr::unite() |
✔️ | ✔️ Create a categorical layer. |
ggplot2::autoplot() |
✔️ | ✔️ |
ggplot2::fortify() |
✔️ to sf through sf::st_as_sf() |
To a tibble with coordinates. |
ggplot2::geom_*() |
✔️ geom_spatvector() |
✔️ geom_spatraster() and
geom_spatraster_rgb(). |
generics::tidy() |
✔️ | ✔️ |
generics::glance() |
✔️ | ✔️ |
generics::required_pkgs() |
✔️ | ✔️ |
[!IMPORTANT]
A note on performance
tidyterra is a user-friendly wrapper around terra that provides tidyverse-style methods and verbs. This approach has a performance cost.
If you frequently use terra or work with large
SpatRasterobjects, terra is usually much faster. Whenever possible, each tidyterra function refers to its equivalent on terra.As a rule of thumb, if your raster has fewer than 10,000,000 data slots, for example
terra::ncell(your_rast) * terra::nlyr(your_rast) < 1e7, tidyterra is a good fit.When plotting rasters, resampling is performed automatically (as
terra::plot()does, see the help page). You can adjust this with themaxcellargument.
Install tidyterra from CRAN:
install.packages("tidyterra")Check the documentation for the development version at https://dieghernan.github.io/tidyterra/dev/
You can install the development version of tidyterra with:
# install.packages("pak")
pak::pak("dieghernan/tidyterra")
Alternatively, you can install tidyterra using r-universe:
# Enable this universe
install.packages(
  "tidyterra",
  repos = c(
    "https://dieghernan.r-universe.dev",
    "https://cloud.r-project.org"
  )
)SpatRaster objectsThis basic example shows how to manipulate and plot
SpatRaster objects:
library(tidyterra)
library(terra)
# Temperatures
rastertemp <- rast(system.file("extdata/cyl_temp.tif", package = "tidyterra"))
rastertemp
#> class : SpatRaster
#> size : 87, 118, 3 (nrow, ncol, nlyr)
#> resolution : 3881.255, 3881.255 (x, y)
#> extent : -612335.4, -154347.3, 4283018, 4620687 (xmin, xmax, ymin, ymax)
#> coord. ref. : World_Robinson (ESRI:54030)
#> source : cyl_temp.tif
#> names : tavg_04, tavg_05, tavg_06
#> min values : 1.885463, 5.817587, 10.463377
#> max values : 13.283829, 16.740898, 21.113781
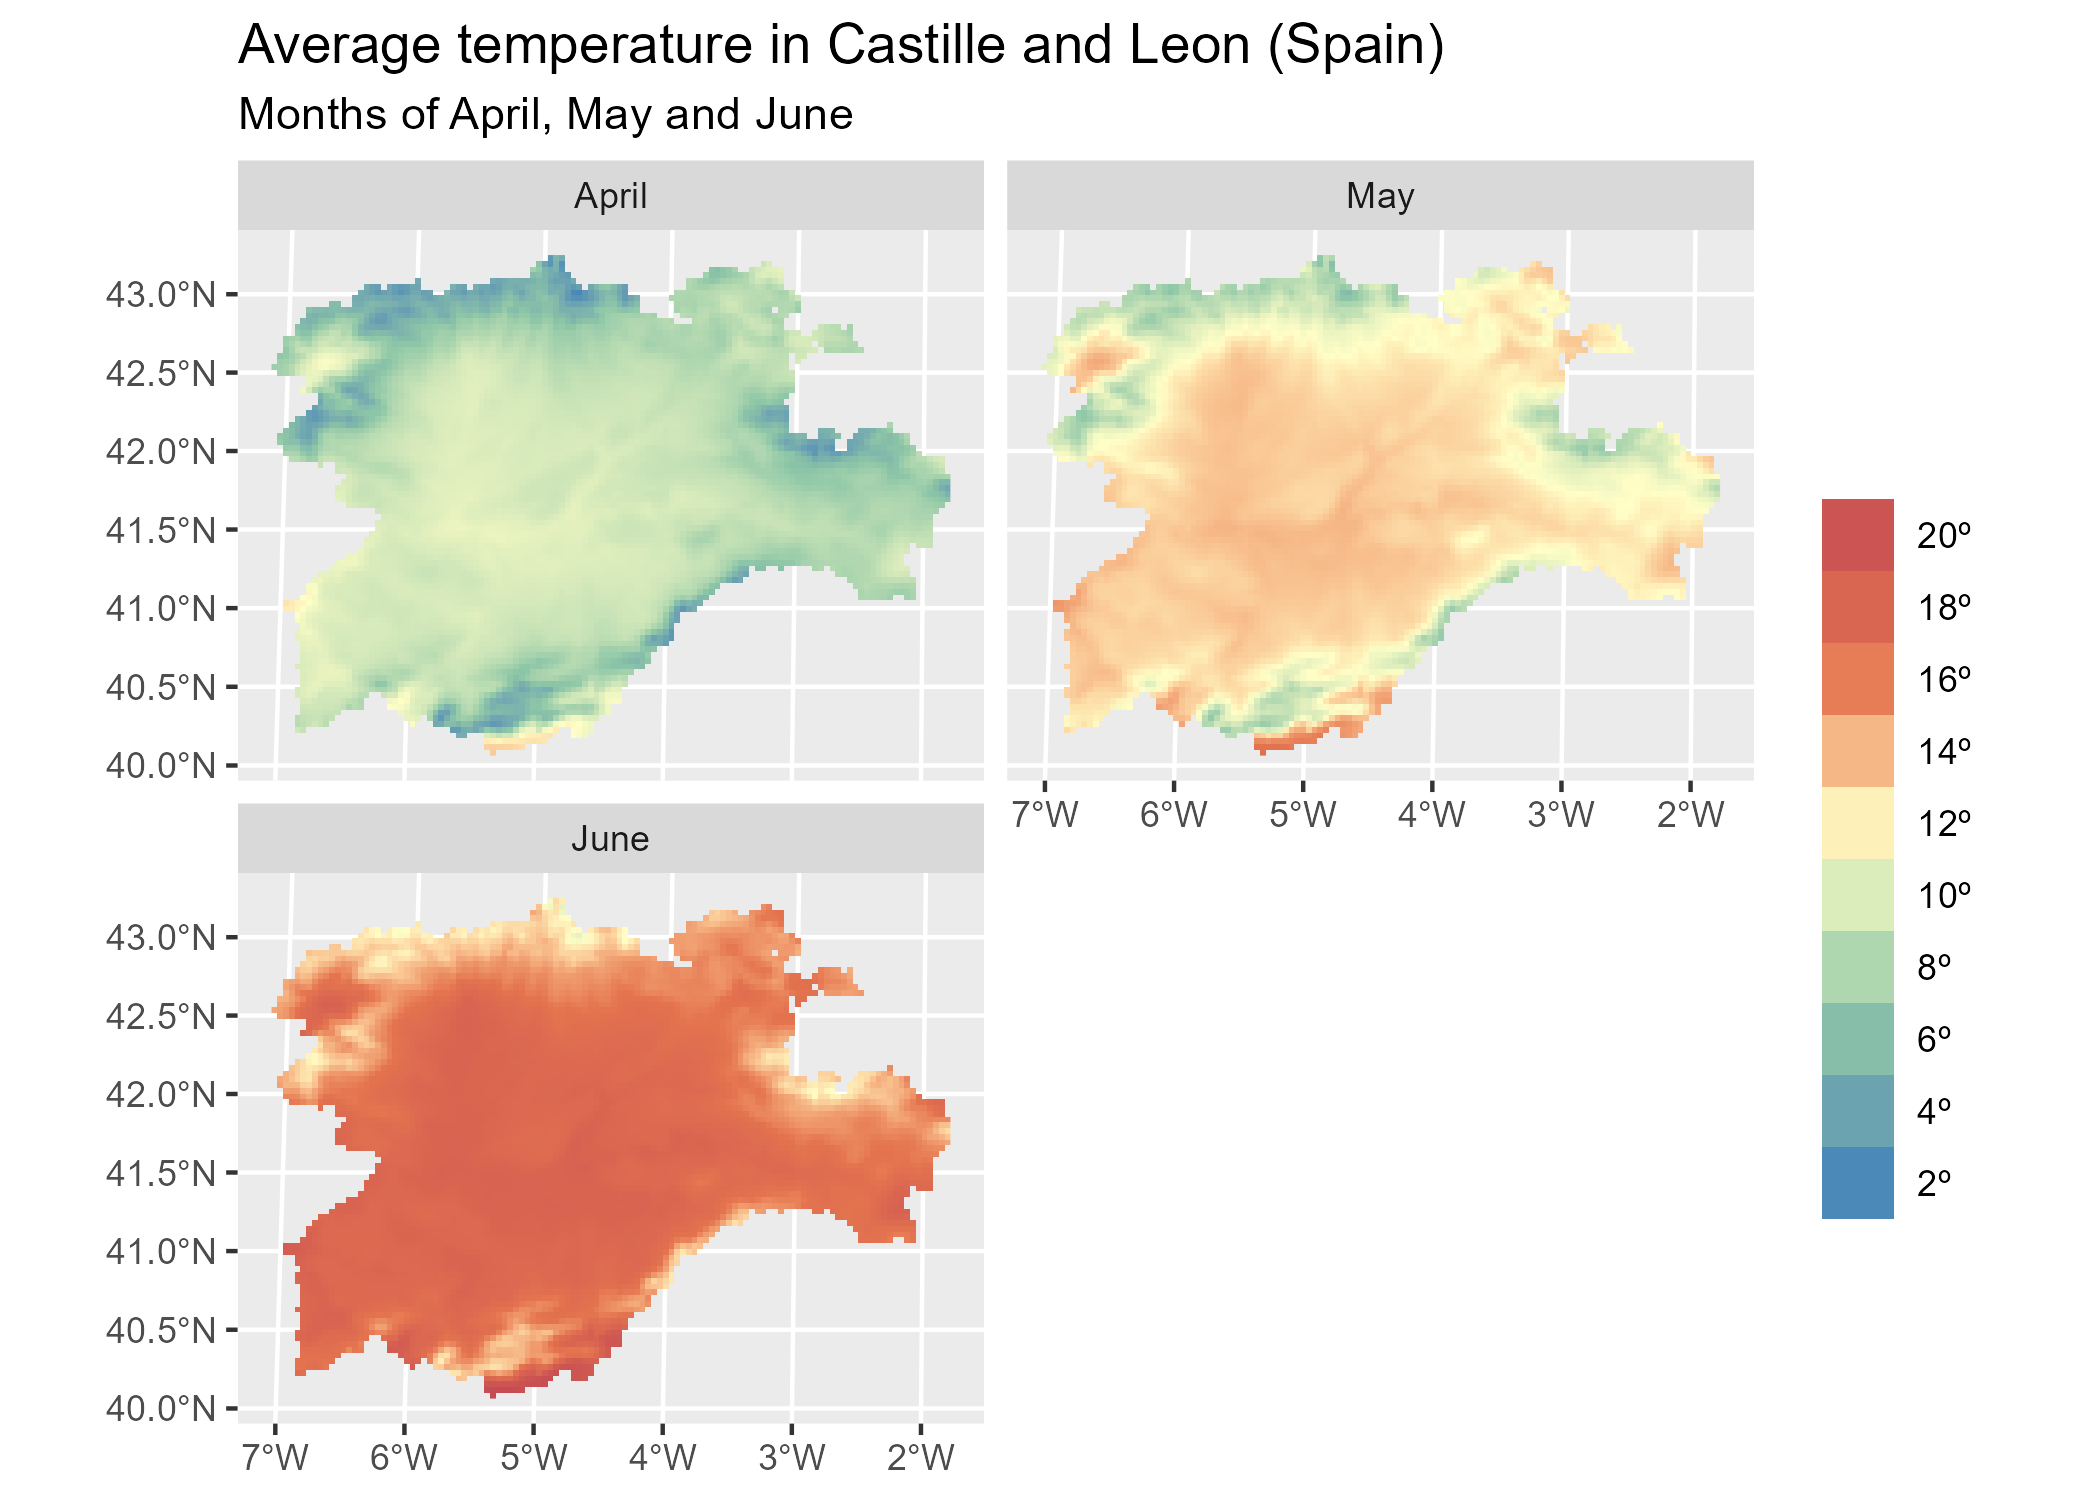
# Rename
rastertemp <- rastertemp |>
rename(April = tavg_04, May = tavg_05, June = tavg_06)
# Facet all layers
library(ggplot2)
ggplot() +
geom_spatraster(data = rastertemp) +
facet_wrap(~lyr, ncol = 2) +
scale_fill_whitebox_c(
palette = "muted",
labels = scales::label_number(suffix = "º"),
n.breaks = 12,
guide = guide_legend(reverse = TRUE)
) +
labs(
fill = "",
title = "Average temperature in Castile and Leon (Spain)",
subtitle = "Months of April, May and June"
)
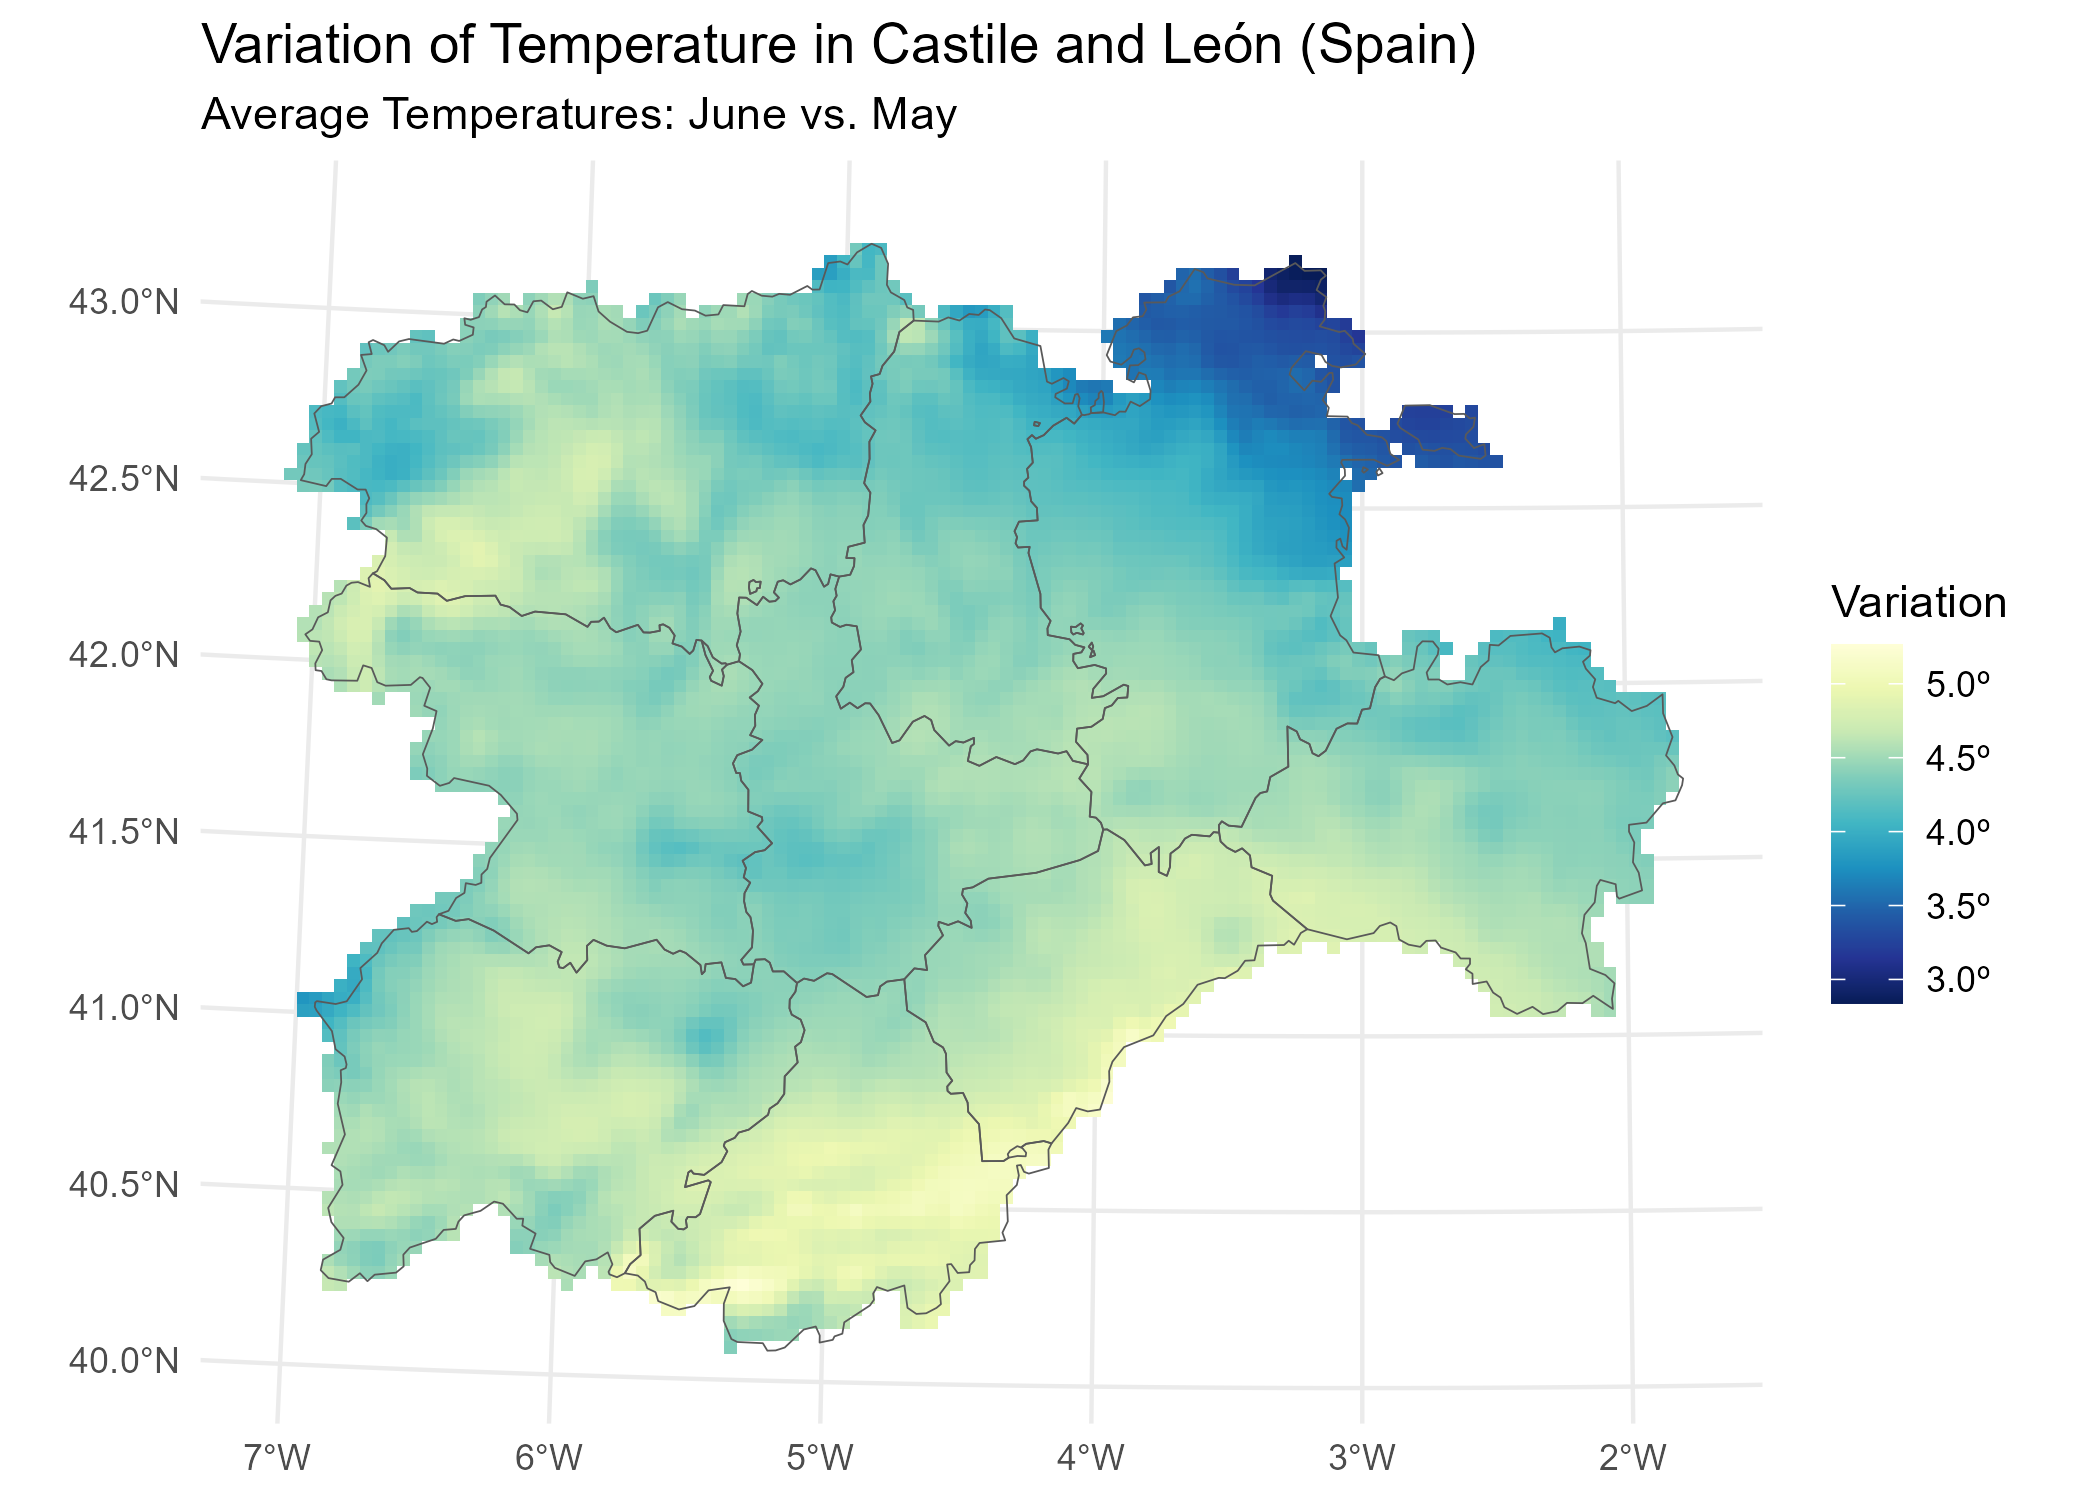
# Create the difference between two months.
variation <- rastertemp |>
  mutate(diff = June - May) |>
  select(variation = diff)

# Add a SpatVector overlay.
prov <- vect(system.file("extdata/cyl.gpkg", package = "tidyterra"))

ggplot(prov) +
  geom_spatraster(data = variation) +
  geom_spatvector(fill = NA) +
  scale_fill_whitebox_c(
    palette = "deep",
    direction = -1,
    labels = scales::label_number(suffix = "º"),
    n.breaks = 5
  ) +
  theme_minimal() +
  coord_sf(crs = 25830) +
  labs(
    fill = "Variation",
    title = "Temperature variation in Castile and Leon (Spain)",
    subtitle = "Average temperatures: June vs. May"
  )
tidyterra also provides a geom for plotting RGB
SpatRaster objects, such as map tiles, with
ggplot2:
rgb_tile <- rast(system.file("extdata/cyl_tile.tif", package = "tidyterra"))

ggplot(prov) +
  geom_spatraster_rgb(data = rgb_tile) +
  geom_spatvector(fill = NA) +
  theme_light() +
  # Change the CRS and datum (useful for relabeling graticules).
  coord_sf(crs = 3857, datum = 3857)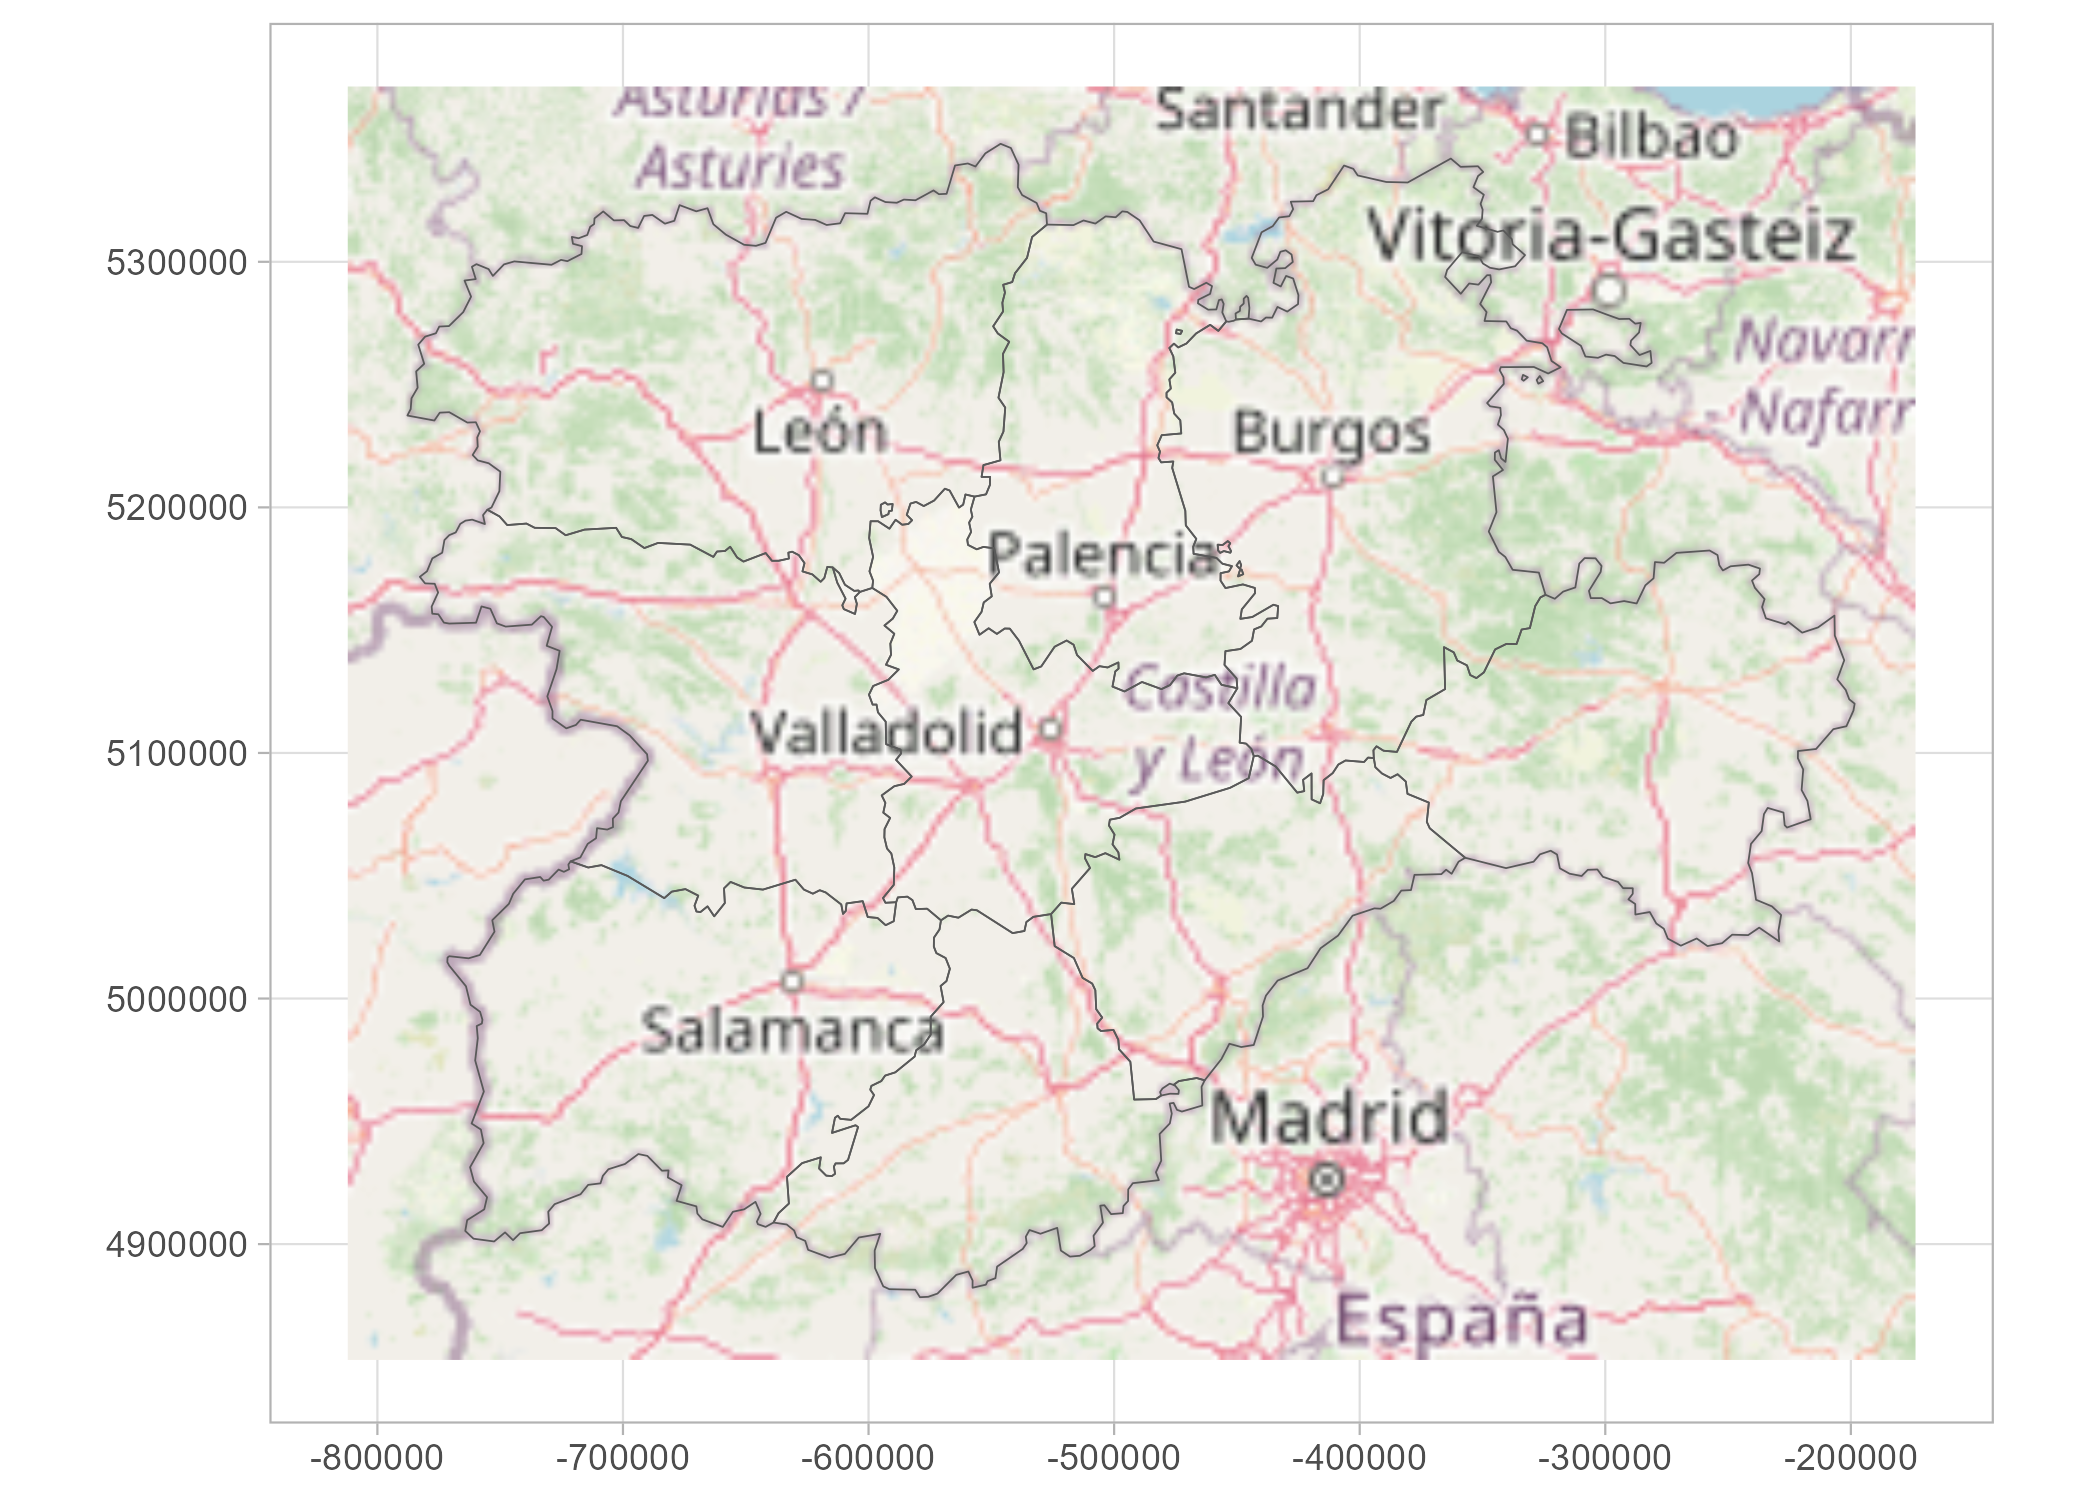
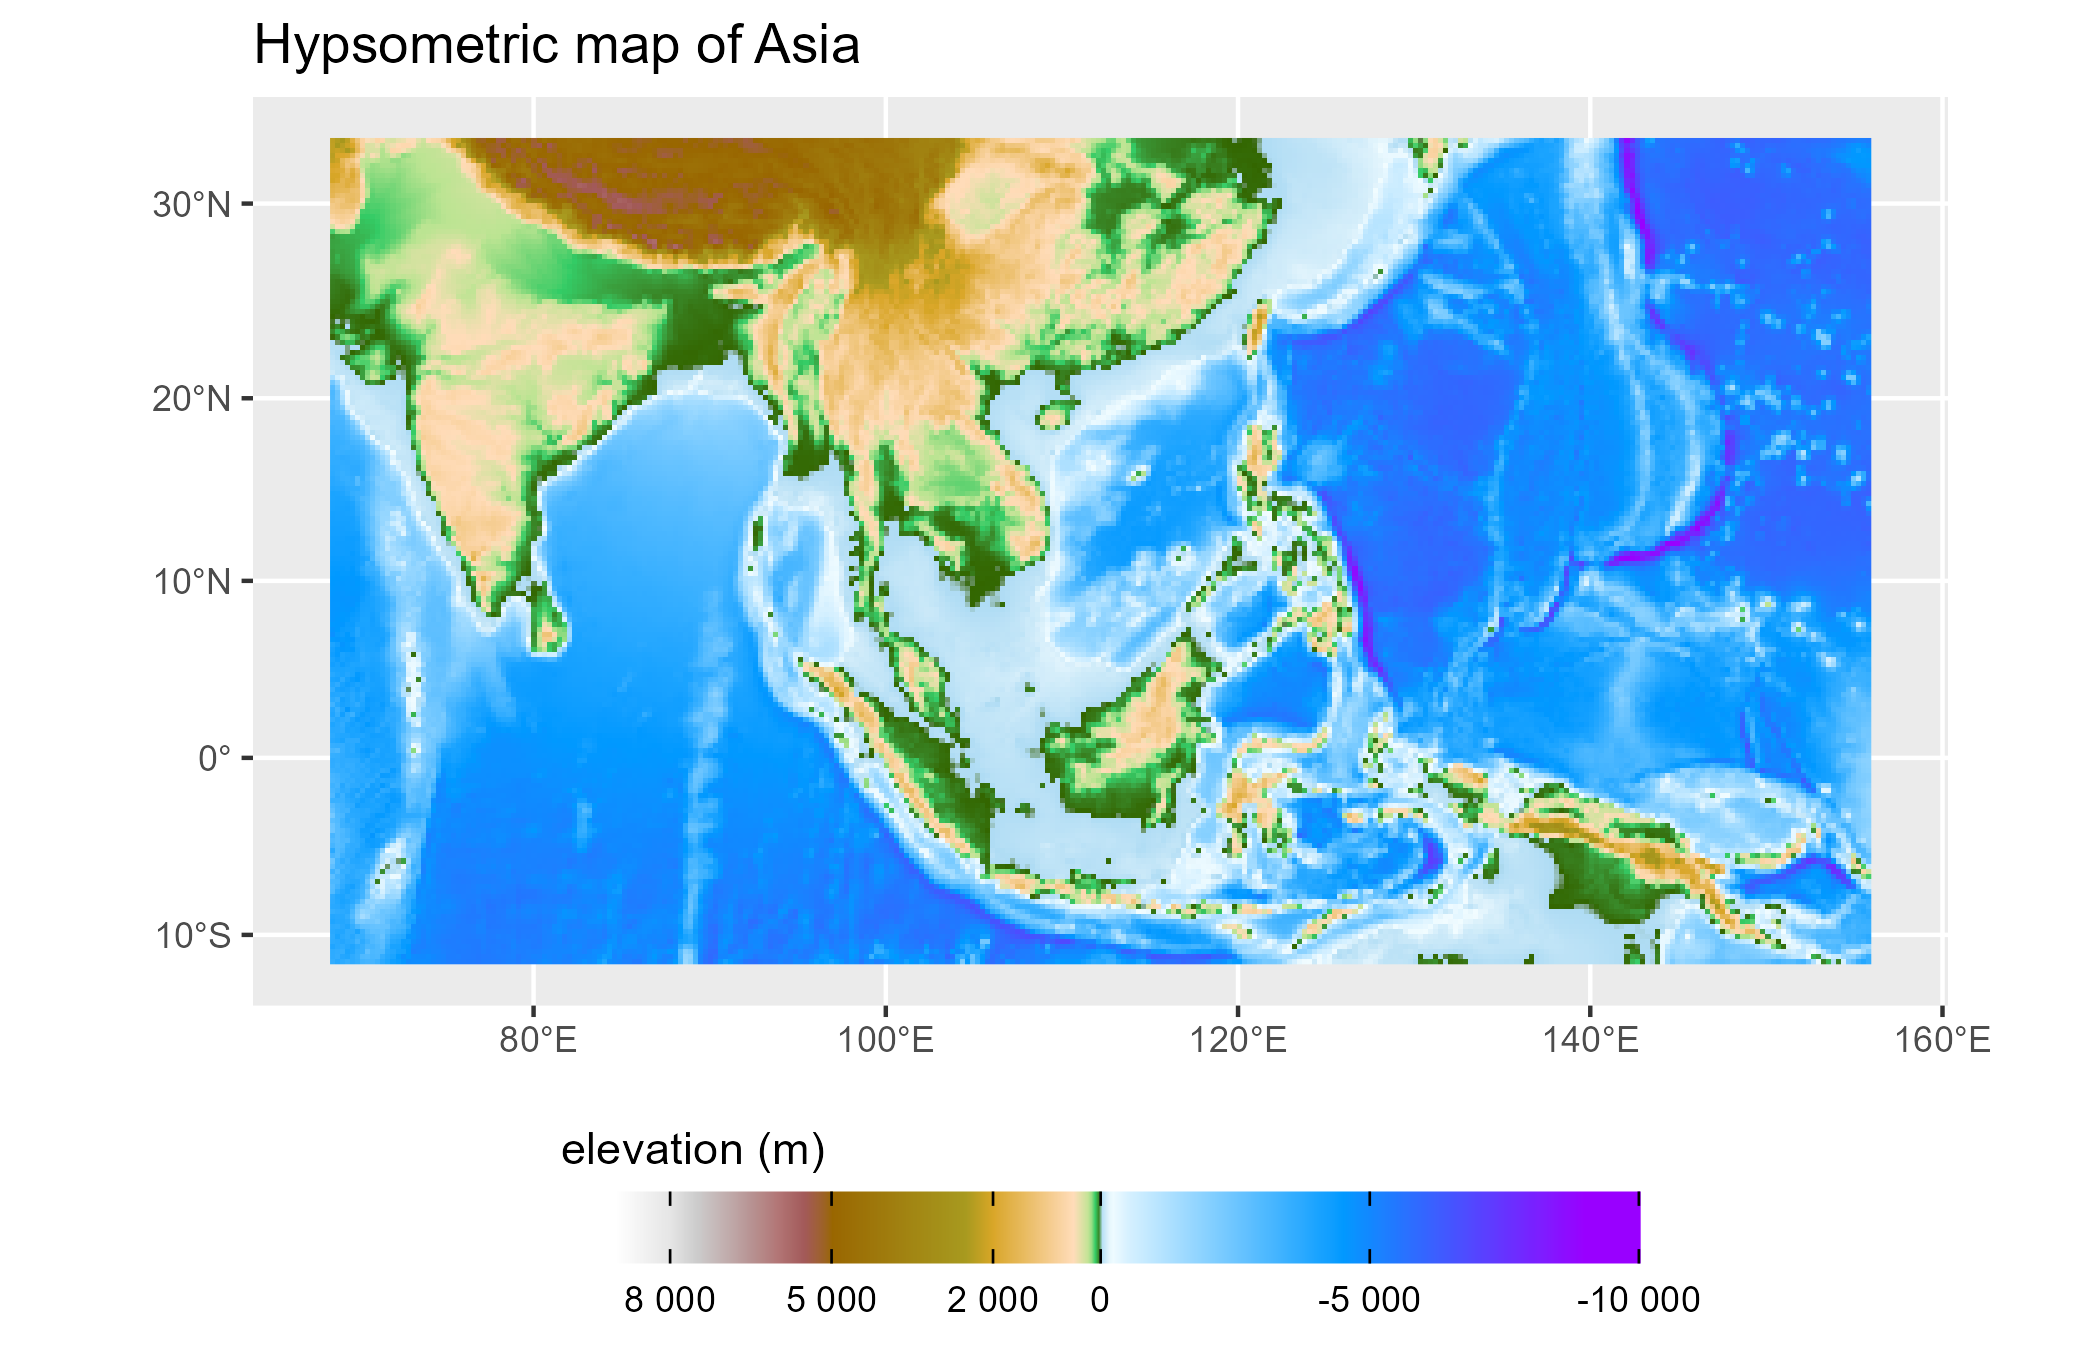
tidyterra provides ggplot2 scales for plotting maps with hypsometric tints:
asia <- rast(system.file("extdata/asia.tif", package = "tidyterra"))

ggplot() +
  geom_spatraster(data = asia) +
  scale_fill_hypso_tint_c(
    palette = "gmt_globe",
    labels = scales::label_number(),
    # Further refinements
    breaks = c(-10000, -5000, 0, 2000, 5000, 8000),
    guide = guide_colorbar(reverse = TRUE)
  ) +
  labs(
    fill = "elevation (m)",
    title = "Hypsometric map of Asia"
  ) +
  theme(
    legend.position = "bottom",
    legend.title.position = "top",
    legend.key.width = rel(3),
    legend.ticks = element_line(colour = "black", linewidth = 0.3),
    legend.direction = "horizontal"
  )
SpatVector objectsThis basic example shows how to manipulate and plot
SpatVector objects:
vect(system.file("ex/lux.shp", package = "terra")) |>
  mutate(pop_dens = POP / AREA) |>
  glimpse() |>
  autoplot(aes(fill = pop_dens)) +
  scale_fill_whitebox_c(palette = "pi_y_g") +
  labs(
    fill = "population per km2",
    title = "Population density of Luxembourg",
    subtitle = "By canton"
  )
#> #  A SpatVector 12 x 7
#> #  Geometry type: Polygons
#> #  Geodetic CRS: lon/lat WGS 84 (EPSG:4326)
#> #  Extent (x / y): ([5° 44' 38.9" E / 6° 31' 41.71" E] , [49° 26' 52.11" N / 50° 10' 53.84" N])
#>
#> $ ID_1     <dbl> 1, 1, 1, 1, 1, 2, 2, 2, 3, 3, 3, 3
#> $ NAME_1   <chr> "Diekirch", "Diekirch", "Diekirch", "Diekirch", "Diekirch", "…
#> $ ID_2     <dbl> 1, 2, 3, 4, 5, 6, 7, 12, 8, 9, 10, 11
#> $ NAME_2   <chr> "Clervaux", "Diekirch", "Redange", "Vianden", "Wiltz", "Echte…
#> $ AREA     <dbl> 312, 218, 259, 76, 263, 188, 129, 210, 185, 251, 237, 233
#> $ POP      <dbl> 18081, 32543, 18664, 5163, 16735, 18899, 22366, 29828, 48187,…
#> $ pop_dens <dbl> 57.95192, 149.27982, 72.06178, 67.93421, 63.63118, 100.52660,…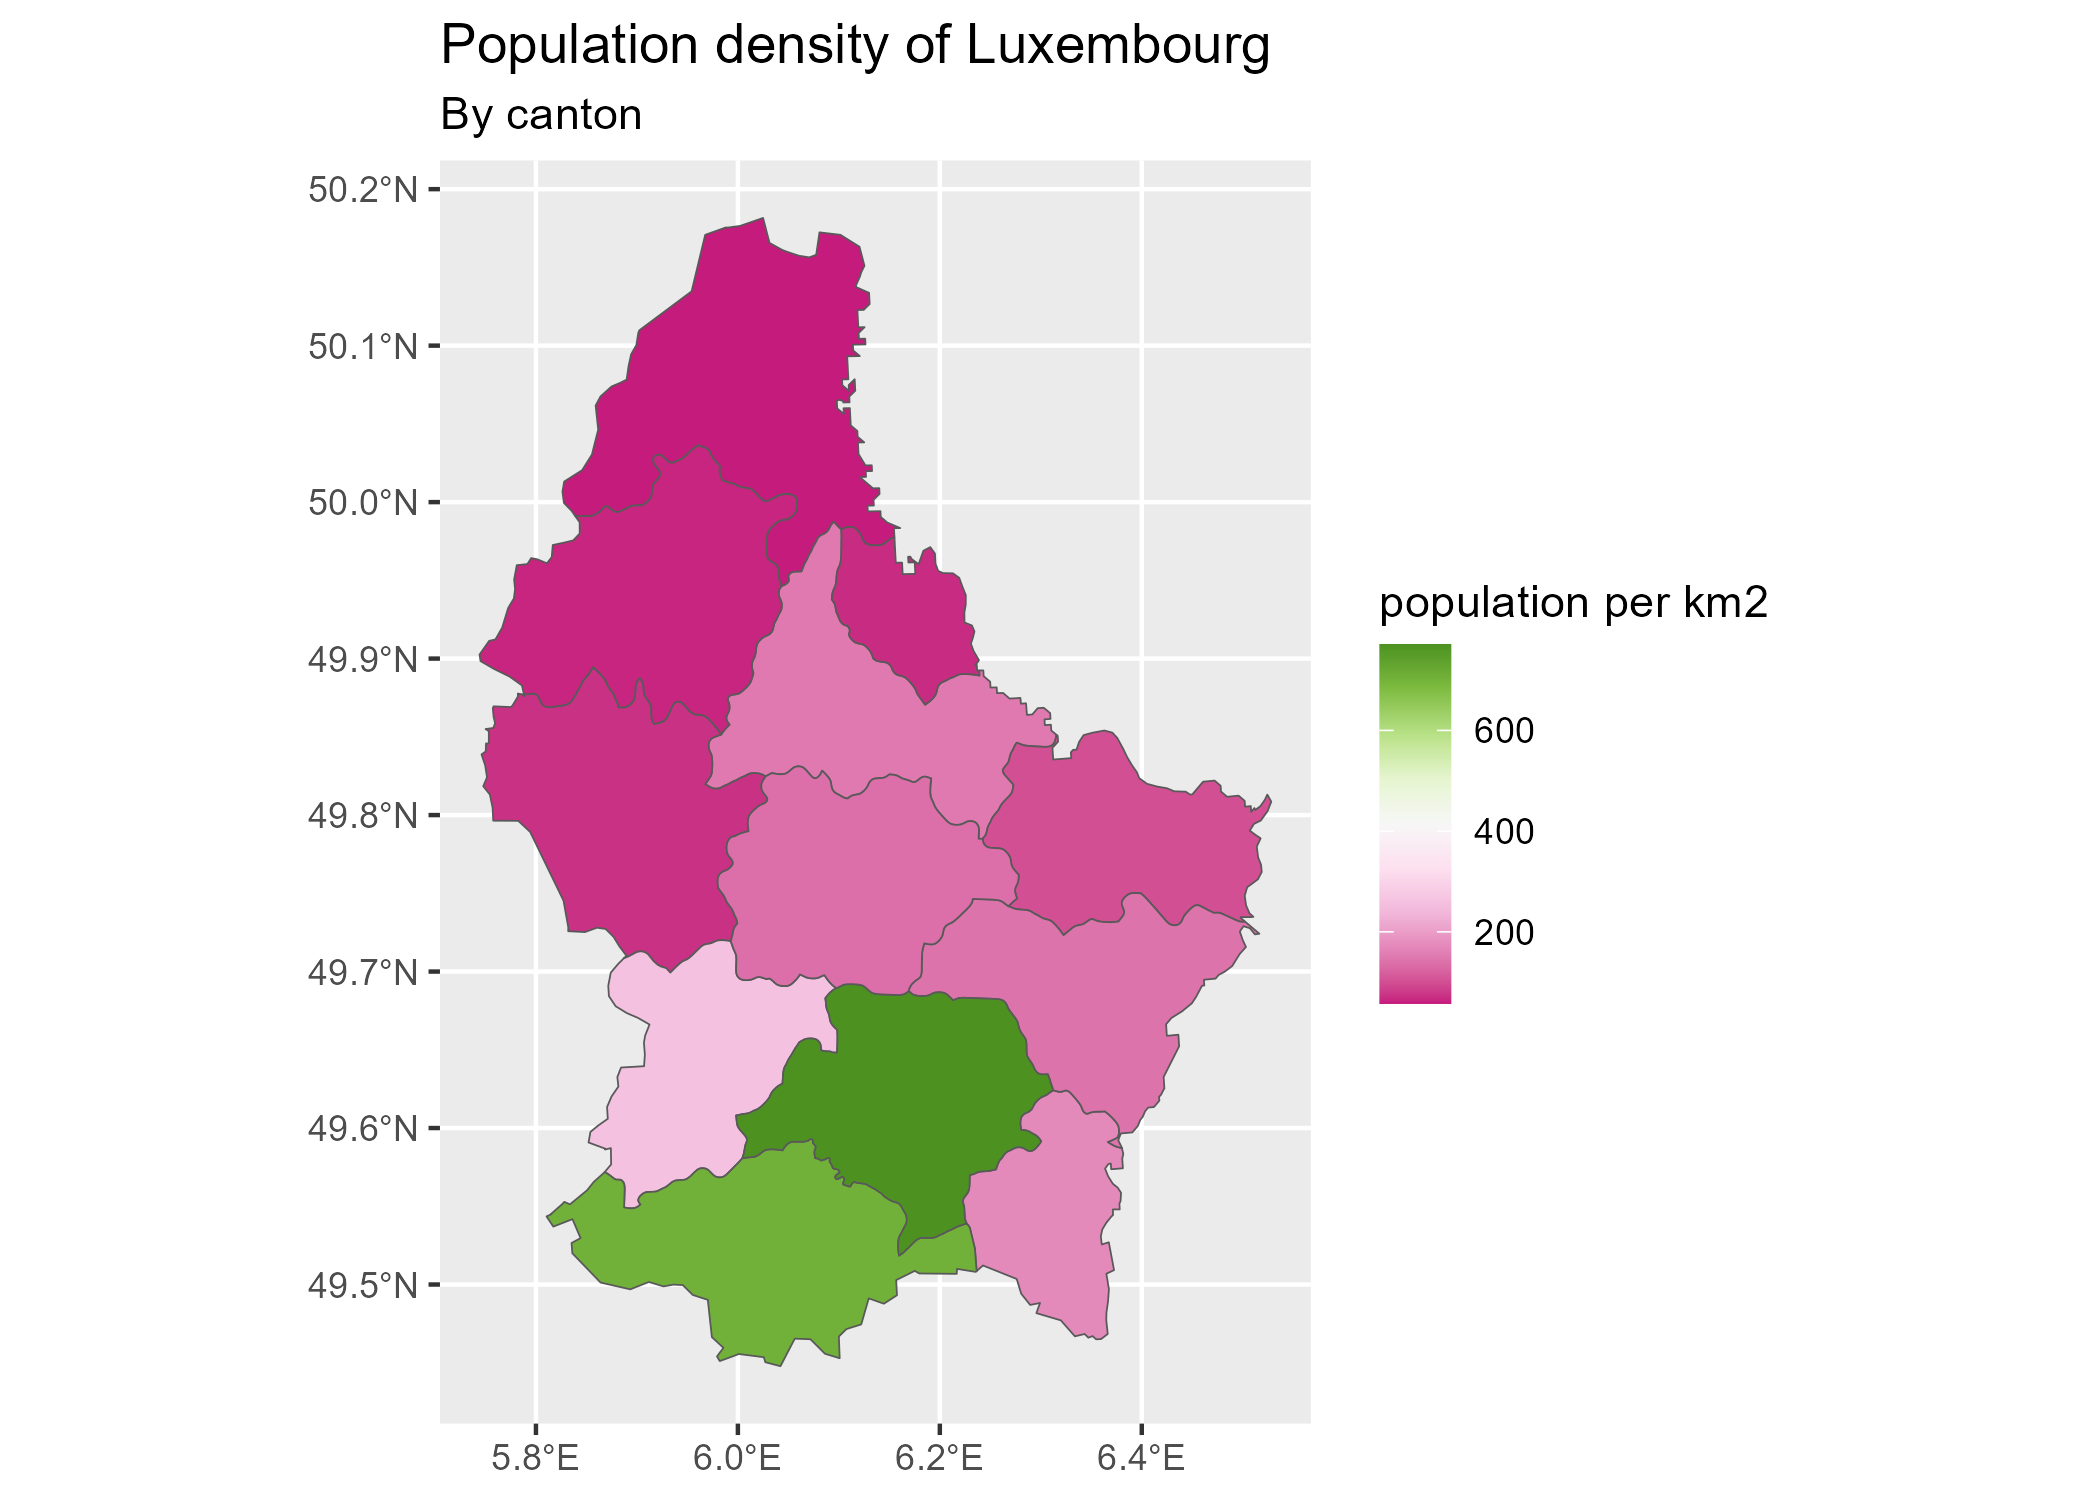
Please leave your feedback or open an issue on https://github.com/dieghernan/tidyterra/issues.
Check the FAQs or open a new issue.
You can also ask in Stack Overflow using the tag [tidyterra].
tidyterra’s ggplot2 geoms are based on the ggspatial implementation by Dewey Dunnington and ggspatial contributors.