

tbl.now
extends tibble() for
storing, validating, and manipulating epidemiological nowcasting data.
It standardizes event dates, report dates, strata, temporal covariates,
and related metadata in a shape compatible with many frameworks,
including diseasenowcasting,
epinowcast, NobBS, surveillance,
EpiNow2, and more.
Finally, it also standardizes the prediction engines and their results
for plotting, scoring, comparing, and ensembling models.
A tbl_now keeps track of the attributes needed for a
nowcasting exercise, so dplyr transformations preserve the
relevant nowcasting variables:
| Argument | What it records | |
|---|---|---|
|
event_date
|
The column storing event dates; i.e. when the epidemiological phenomenon of interest happened (symptom onset, hospitalisation, death, …). Required. |
|
report_date
|
The column storing report dates; i.e. when that event
became known to the surveillance system. Required,
unless it is reconstructed from delay.
|

|
revision_date
|
An optional third date indicating when the report was resolved (see
revision_type). Optional.
|

|
revision_type, revision_levels
|
What the revision date resolved to. Only confirmed,
retracted, pending or NA are ever
stored; set revision_levels as a named dictionary mapping
the data’s labels into those four ( e.g. c(positive =
“confirmed”)). Optional.
|
|
now
|
The date the nowcast is anchored to — “today” from the model’s point of view. Optional; defaults to the latest date. |
|
strata
|
Columns you want a separate nowcast for (e.g. gender, region). Optional. |

|
covariates
|
Columns that inform the nowcast but that you do not want it broken down by (e.g. temperature or precipitation). Optional. |

|
case_count
|
The column holding the counts when the data is given as aggregated (rather than line-list). Optional. |
|
data_type
|
Whether the data represents a linelist (each row is a
case), count-incidence(each row is a collection of cases
per event-report date) or count-cumulative(each row is the
cummulative number cases for that event accumulating in the report
axis). Optional; inferred by default.
|

|
event_units, report_units,
revision_units
|
The time grid each date lives on: days, weeks,
months, years or numeric.
Optional; inferred (“auto”) by default.
|

|
is_censored_report,is_censored_revision
|
Flags dates from either the report or the revision axis that are only an upper bound, i.e. the true report happened before the date given in the database. Optional. |

|
t_effects
|
Columns holding temporal effects (day of week, holidays, …) that some models can use. Optional. |
You can specify an object as a tbl.now with the
tbl_now command:
library(dplyr)
library(tbl.now)
data(denguedat)

#Here we use just a few dates for the example
denguedat <- denguedat |>
  filter(onset_week >= as.Date("2005/01/01"),
         report_week <= as.Date("2005/10/01"))

#And we specify as a tbl_now:
denguedat <- denguedat |>
  tbl_now(
    report_date = report_week,
    event_date = onset_week,
    strata = gender
  )

#Which is just a tibble with extra attributes
denguedat
#> # A tibble:  1,652 × 6
#> # Data type: "linelist"
#> # Frequency: Event: `weeks` | Report: `weeks`
#>   onset_week   report_week   gender   .event_num .report_num .delay
#>   <date>       <date>        <chr>         <dbl>       <dbl>  <dbl>
#>   [event_date] [report_date] [strata]      [...]       [...]  [...]
#> 1 2005-01-03   2005-01-17    Male              0           2      2
#> 2 2005-01-03   2005-01-10    Female            0           1      1
#> 3 2005-01-03   2005-01-10    Female            0           1      1
#> 4 2005-01-03   2005-01-10    Male              0           1      1
#> 5 2005-01-03   2005-01-10    Male              0           1      1
#> # ────────────────────────────────────────────────────────────────────────────────────────────────────────────────────────────────────────────────────────────────
#> # Now: 2005-09-26 | Event date: "onset_week" | Report date: "report_week"
#> # Strata: "gender"
#> # ────────────────────────────────────────────────────────────────────────────────────────────────────────────────────────────────────────────────────────────────
#> # ℹ 1,647 more rows
Once transformed, it can help you diagnose data problems (see this article) or modeling requirements with your database:
autoplot(denguedat)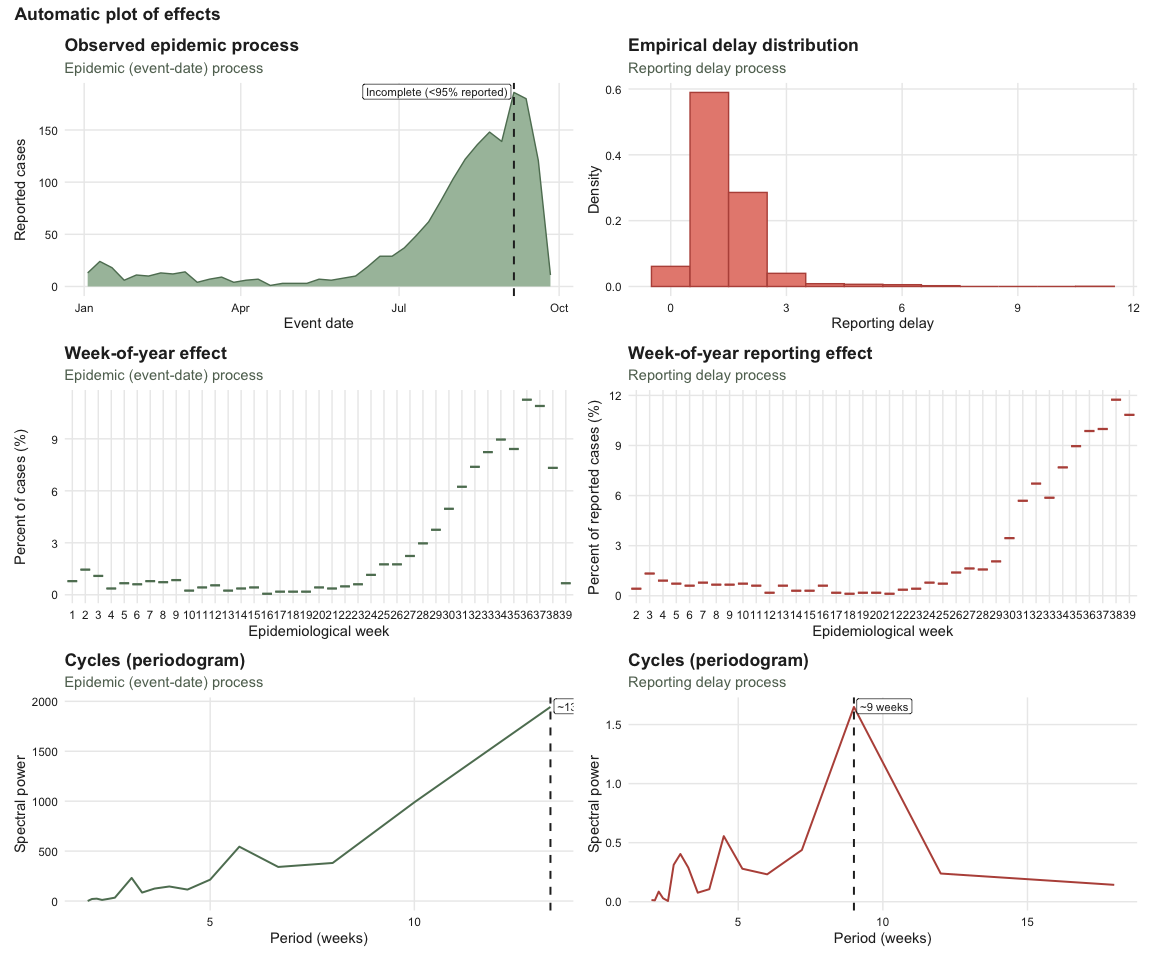
And it can be used to run any of multiple nowcast libraries through
the engine() and run_nowcast specifications
(see this
article). For example, baselinenowcast:
dengue_nowcast_1 <- denguedat |>
run_nowcast(engine = engine_baselinenowcast())autoplot(dengue_nowcast_1)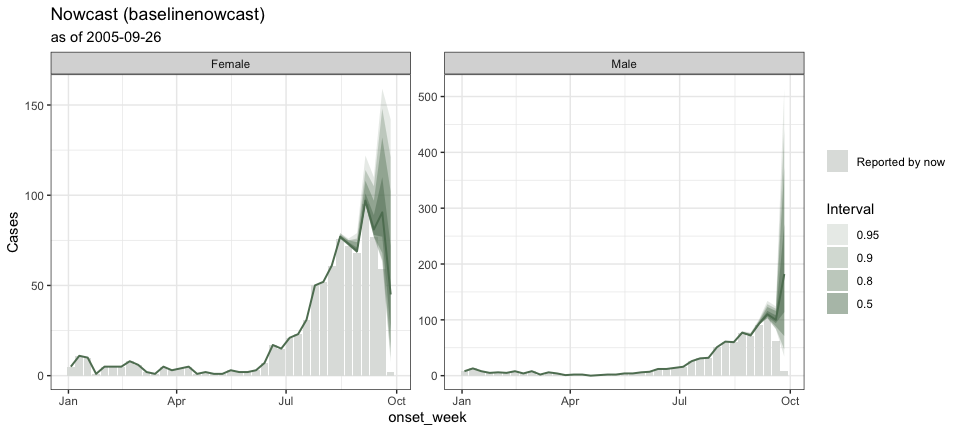
dengue_nowcast_2 <- denguedat |>
run_nowcast(engine = engine_diseasenowcasting())autoplot(dengue_nowcast_2)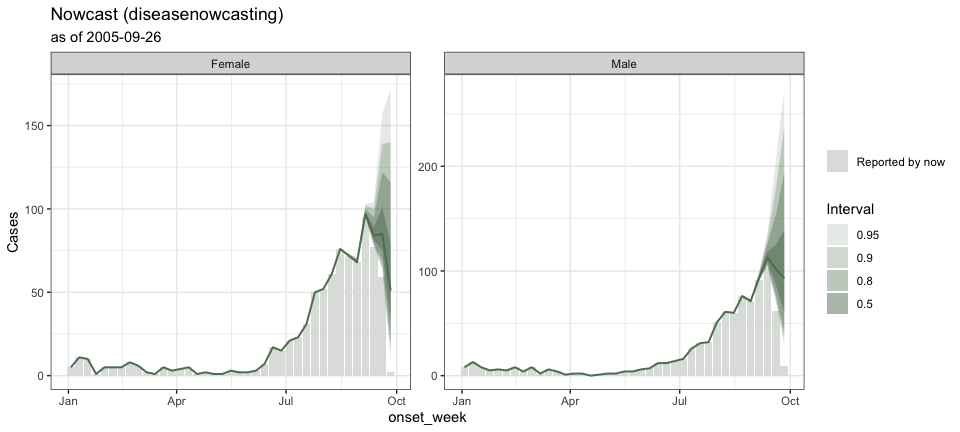
It can also generate ensemble nowcasts combining multiple engines or multiple realizations from the same engine as you can see in this article:
dengue_ensemble <- nowcast_ensemble(
  baselinenowcast   = dengue_nowcast_1,
  diseasenowcasting = dengue_nowcast_2
)autoplot(dengue_ensemble)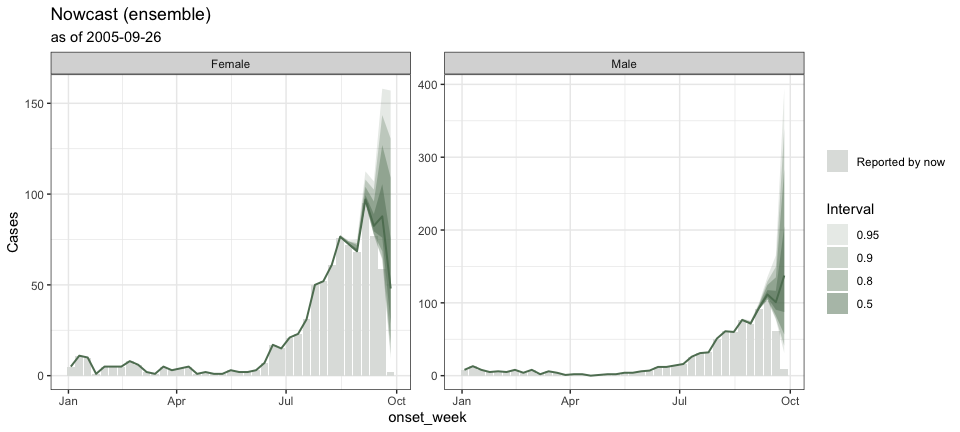
If this seems as exciting to you as it is to us, install the development version from R universe:
install.packages("tbl.now", repos = c("https://rodrigozepeda.r-universe.dev", getOption("repos")))and checkout our articles starting with the Get started guide:
If you have any questions or comments regarding the contents of this article please open an issue on Github.
tbl_now object: every
attribute, the three data types, the revision process, temporal effects
and the dplyr methods: https://rodrigozepeda.github.io/tbl.now/articles/more-on-tbl-now.htmltbl.now https://rodrigozepeda.github.io/tbl.now/articles/diagnosing-a-tbl-now.htmltbl.now https://rodrigozepeda.github.io/tbl.now/articles/batches.htmltbl.now:
here you can learn how it connects to the other nowcasting
packages. https://rodrigozepeda.github.io/tbl.now/articles/nowcasting-models.html