![]()
The goal of sugrrants is to provide supporting graphs with R for analysing time series data. It aims to fit into the tidyverse and grammar of graphics framework for handling temporal data.
You could install the stable version on CRAN:
install.packages("sugrrants")You could also install the development version from Github using:
# install.packages("remotes")
remotes::install_github("earowang/sugrrants")The fully-fledged faceting calendar facet_calendar()
unlocks day-to-day stories.
library(dplyr)
library(sugrrants)
hourly_peds %>%
  filter(Date < as.Date("2016-05-01")) %>%
  ggplot(aes(x = Time, y = Hourly_Counts, colour = Sensor_Name)) +
  geom_line() +
  facet_calendar(~ Date) + # a variable contains dates
  theme_bw() +
  theme(legend.position = "bottom")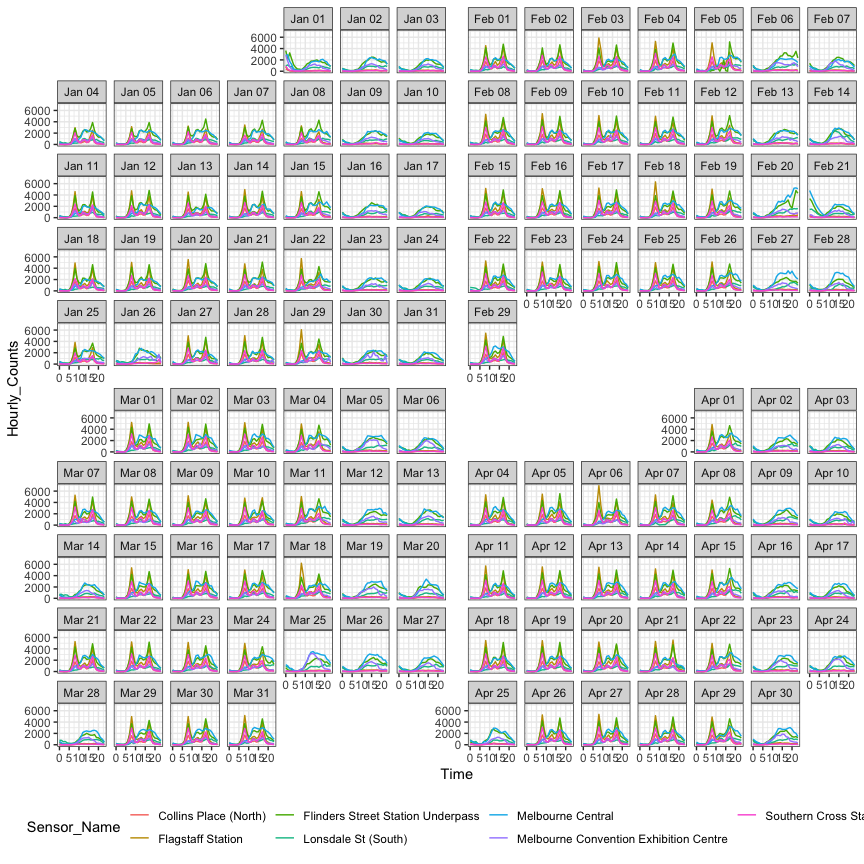
On the other hand, the frame_calendar() provides tools
for re-structuring the data into a compact calendar layout, without
using the faceting method. It is fast and light-weight, although it does
not preserve the values.
p <- hourly_peds %>%
  filter(Sensor_ID == 9, Year == 2016) %>%
  mutate(Weekend = if_else(Day %in% c("Saturday", "Sunday"), "Weekend", "Weekday")) %>%
  frame_calendar(x = Time, y = Hourly_Counts, date = Date) %>%
  ggplot(aes(x = .Time, y = .Hourly_Counts, group = Date, colour = Weekend)) +
  geom_line() +
  theme(legend.position = "bottom")
prettify(p)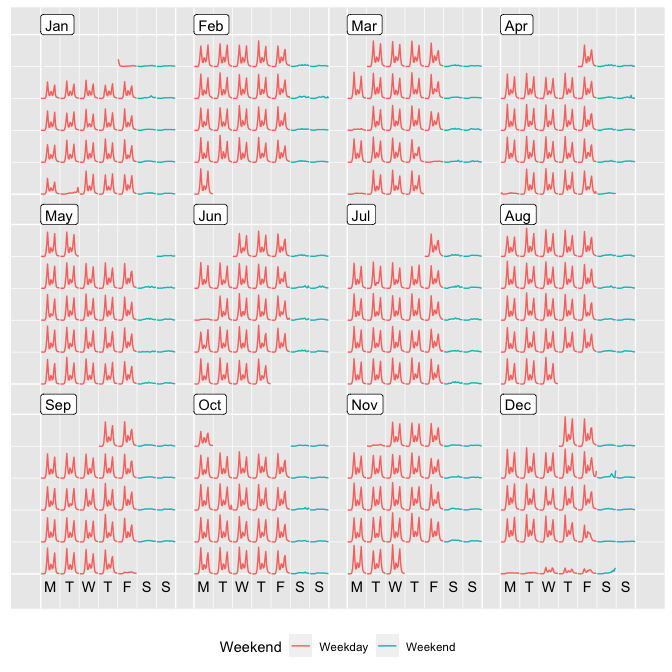
This package is part of the project—Tidy data structures and visual methods to support exploration of big temporal-context data, which has been participated in Google Summer of Code 2017 (gsoc), for R project for statistical computing.
A new function frame_calendar() [here
and here]
in the sugrrants package has been developed and
documented for calendar-based graphics. I have also written a vignette
[source
and reader
view], which introduces and demonstrates the usage of the
frame_calendar() function. Many
unit tests have been carried out to ensure the expected performance
of this function. The function implements non-standard evaluation and
highlights the tidy evaluation in
action. The initial release (v0.1.0) of the package has been published
on CRAN
during the gsoc summer time.
I have initialised a new R package tsibble
for tidy temporal data, as part of the project. The
tsibble() function constructs a new tbl_ts
class for temporal data, and the as_tsibble() helps to
convert a few ts objects into the tbl_ts
class. Some key verbs (generics) from the dplyr
package, such as mutate(), summarise(),
filter(), have been defined and developed for the
tbl_ts data class. The tsibble package was
highly experimental over the period of the gsoc [commits],
and these functions are very likely to be changed or improved in the
future.
walk_melb()
and shine_melb(),
have been written and documented as the v0.1.0 and v0.2.0 releases on
CRAN. The majority of the code for the function run_melb()
has been done, but the interface needs improving after the gsoc.
The acronym of sugrrants is SUpporting GRaphs with R for ANalysing Time Series, pronounced as “sugar ants” that are a species of ant endemic to Australia.
Please note that this project is released with a Contributor Code of Conduct. By participating in this project you agree to abide by its terms.