
![]()

![]()

![]()
The goal of the package is to allow easy applications of continuous time CUSUM procedures on survival data. Specifically, the Biswas & Kalbfleisch CUSUM (2008) and the CGR-CUSUM (Gomon et al. 2022).
Besides continuous time procedures, it is also possible to construct the Bernoulli (binary) CUSUM and funnel plot (Spiegelhalter 2005) on survival data.
You can install the released version of success from CRAN with:
install.packages("success")And the development version from GitHub with:
# install.packages("devtools")
devtools::install_github("d-gomon/success")This is a basic example which shows you how to construct a CGR-CUSUM chart on a hospital from the attached data set “surgerydat”:
dat <- subset(surgerydat, unit == 1)
exprfit <- as.formula("Surv(survtime, censorid) ~ age + sex + BMI")
tcoxmod <- coxph(exprfit, data = surgerydat)

cgr <- cgr_cusum(data = dat, coxphmod = tcoxmod, stoptime = 200)
plot(cgr)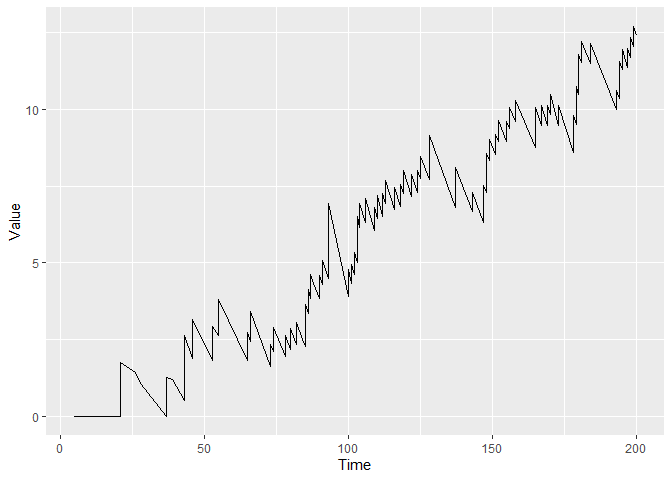
You can plot the figure with control limit h = 10 by
using:
plot(cgr, h = 10)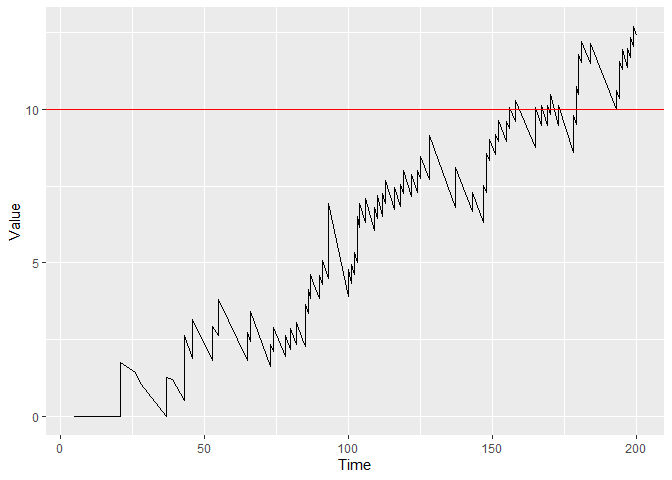
And determine the runlength of the chart when using control limit
h = 10:
runlength(cgr, h = 10)
#> [1] 151
Using a control limit of h = 10 Hospital 1 would be
detected by a CGR-CUSUM 151 days after the first patient entered the
study.
Gomon D., Putter H., Nelissen R.G.H.H., van der Pas S (2022): CGR-CUSUM: A Continuous time Generalized Rapid Response Cumulative Sum chart, Biostatistics
Biswas P. and Kalbfleisch J.D. (2008): A risk-adjusted CUSUM in continuous time based on the Cox model, Statistics in Medicine
Spiegelhalter D.J. (2005): Funnel plots for comparing institutional performance, Statistics in Medicine