Authors:
Deoclecio Amorim - amorim@cena.usp.br, CENA-USP
João Novoletti - joao.novoletti@gmail.com
The goal of seinfitR is to fit the Seinhorst equation to experimental data describing the relationship between preplant nematode densities and plant growth using nonlinear least squares fitting.
You can install the development version of seinfitR from GitHub with:
# install.packages("pak")
pak::pak("dslabcena/seinfitR")
Alternatively, if you’d like to install the stable version of seinfitR from CRAN, run:
install.packages("seinfitR")The syntax of seinfitR is straightforward, with the main function being seinfitR(…).
Modeling plant response to nematode densities using the “glasshouse” dataset:
library(seinfitR)

data(glasshouse, package = "seinfitR")


# Fit the model
model <- seinfitR(p_i = "p_i", y = "y", data = glasshouse,
                  start = list(m = 6, t = 6),
                  control = seinfitR_control(maxiter = 20), z_fixed = TRUE)
#> The Z_fixed parameter is set to TRUE: using the default value for z^t from Seinhorst (1986).
#> Model fitting completed successfully.

# View model summary
summary(model)
#> Seinhorst Model - Parameter Estimates
#> -----------------------------------------------------
#>         Estimate  Std. Error   t value     Pr(>|t|)
#> m      0.5951683 0.008177824  72.77832 4.096851e-16
#> t      1.6829177 0.116059892  14.50042 1.627030e-08
#> y_max 10.3675895 0.053752628 192.87596 9.127161e-21
#> -----------------------------------------------------
#> R2 - R squared (Coefficient of Determination):  0.9949782
#> Adjusted_R2 - Adjusted R squared:               0.9940652
#> -----------------------------------------------------
The seinfitR package provides some methods for model evaluation and visualization:
# Print model dependent/predictor variables, number of observations, and parameter estimates
print(model)
#> Seinhorst Model Fit Summary
#> -----------------------------------------------------
#> Dependent Variable:              y
#> Predictor Variable:              p_i
#> Number of Observations:          14
#>
#> Coefficients:
#>       Estimate Std. Error t value  Pr(>|t|)
#> m       0.5952   0.008178   72.78 4.097e-16
#> t       1.6829   0.116060   14.50 1.627e-08
#> y_max  10.3676   0.053753  192.88 9.127e-21
#> -----------------------------------------------------

# Extract variance-covariance matrix
vcov(model)
#>                   m            t         y_max
#> m      6.687681e-05 -0.000364986 -0.0001181826
#> t     -3.649860e-04  0.013469898 -0.0024948229
#> y_max -1.181826e-04 -0.002494823  0.0028893450

#Extract model coefficients
coef(model)
#>          m          t      y_max
#>  0.5951683  1.6829177 10.3675895

# Calculate R-squared
r_squared(model)
#> $R2
#> [1] 0.9949782
#>
#> $Adjusted_R2
#> [1] 0.9940652

# Calculate Plot
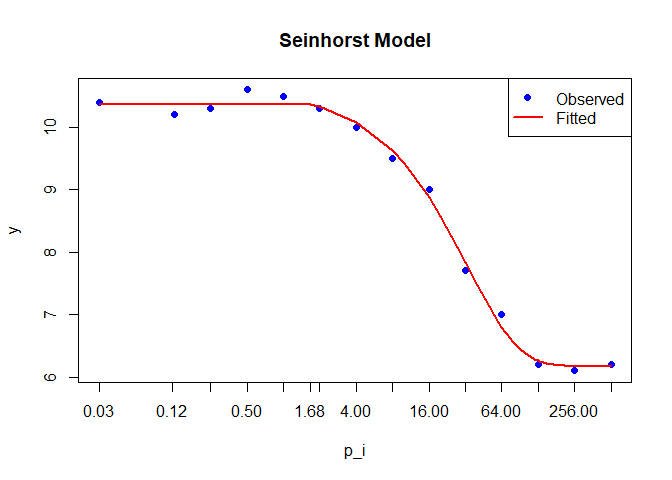
plot(model)
Methods Available for seinfitR Objects
methods(class = "seinfitR")
#> [1] coef      plot      predict   print     r_squared summary   vcov
#> see '?methods' for accessing help and source code
License
The seinfitR package is licensed under the GNU General Public License, version 3, see file LICENSE.md. © 2025 Deoclecio J. Amorim & João Novoletti.