![]()
![]()
This R package enables researchers to sample redistricting plans from a pre-specified target distribution using Sequential Monte Carlo and Markov Chain Monte Carlo algorithms. The package supports various constraints in the redistricting process, such as geographic compactness and population parity requirements. Tools for analysis, including computation of various summary statistics and plotting functionality, are also included.
redist is available on CRAN and can be installed
using:
install.packages("redist")You can also install the most recent development version of
redist (which is usually quite stable) using the
remotes package.
if (!require(remotes)) install.packages("remotes")
remotes::install_github("alarm-redist/redist@dev", dependencies=TRUE)A basic analysis has two steps. First, you define a redistricting
plan using redist_map. Then you simulate plans using one of
the algorithm functions: redist_smc,
redist_flip, and redist_mergesplit.
library(redist)
library(dplyr)

data(iowa)

# set a 0.1% population constraint
iowa_map = redist_map(iowa, existing_plan=cd_2010, pop_tol=0.001, total_pop = pop)
# simulate 500 plans using the SMC algorithm
iowa_plans = redist_smc(iowa_map, nsims=500)
#> SEQUENTIAL MONTE CARLO
#> Sampling 500 99-unit maps with 4 districts and population between 760827 and 762350.
After generating plans, you can use redist’s plotting
functions to study the geographic and partisan characteristics of the
simulated ensemble.
library(ggplot2)
library(patchwork) # for plotting

redist.plot.plans(iowa_plans, draws=c("cd_2010", "1", "2", "3"), shp=iowa_map)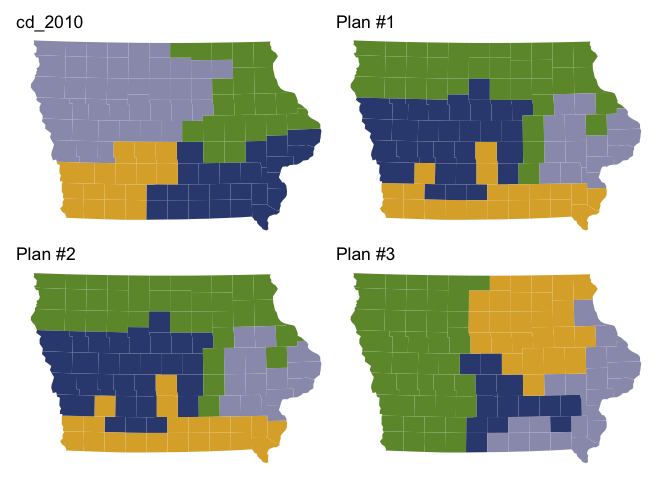
iowa_plans = iowa_plans %>%
    mutate(Compactness = comp_polsby(pl(), iowa_map),
           `Population deviation` = plan_parity(iowa_map),
           `Democratic vote` = group_frac(iowa_map, dem_08, tot_08))
#> Linking to GEOS 3.13.0, GDAL 3.8.5, PROJ 9.5.1; sf_use_s2() is TRUE

hist(iowa_plans, `Population deviation`) + hist(iowa_plans, Compactness) +
    plot_layout(guides="collect") +
    plot_annotation(title="Simulated plan characteristics")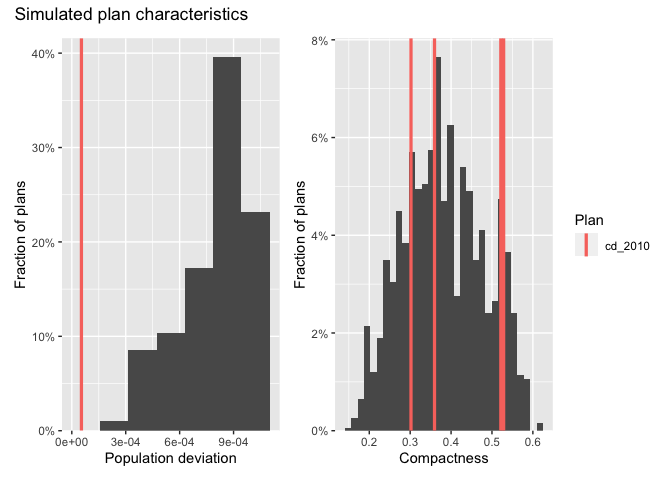
redist.plot.scatter(iowa_plans, `Population deviation`, Compactness) +
    labs(title="Population deviation and compactness by plan")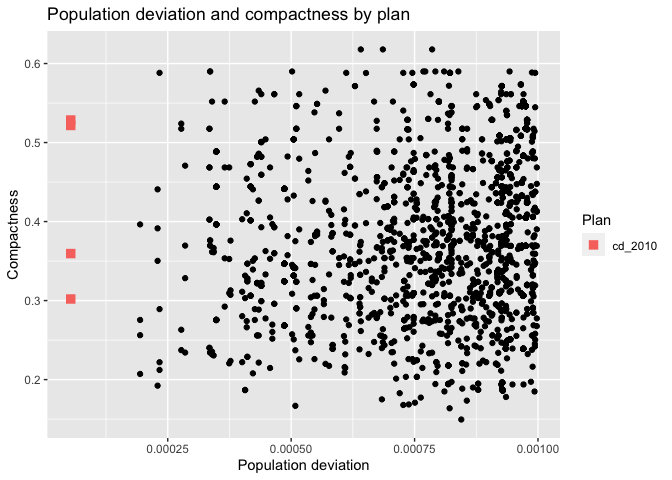
plot(iowa_plans, `Democratic vote`, size=0.5, color_thresh=0.5) +
    scale_color_manual(values=c("black", "tomato2", "dodgerblue")) +
    labs(title="Democratic vote share by district")
#> Ignoring unknown labels:
#> • shape : "Plan"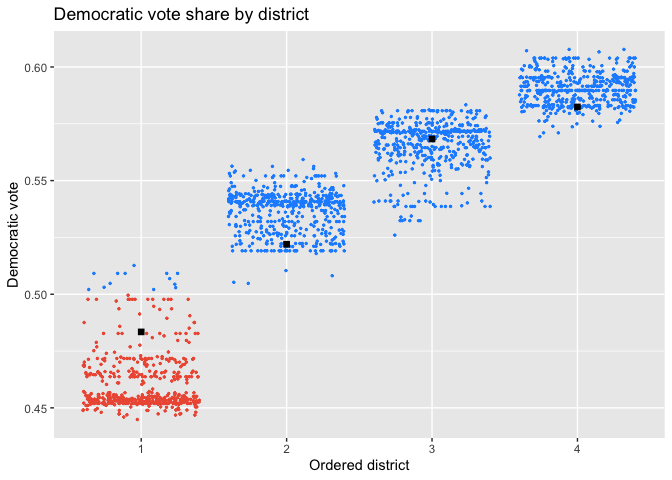
A more detailed introduction to redistricting methods and the package can be found in the Get Started page. The package vignettes contain more detailed information and guides to specific workflows.