![]()
readtextgrid parses Praat textgrids into tidy R dataframes.
read_textgrid() and
read_textgrid_lines()).Install readtextgrid from CRAN:
install.packages("readtextgrid")Development version. Install precompiled version of readtextgrid from R-universe:
install.packages(
  "readtextgrid",
  repos = c("https://tjmahr.r-universe.dev", "https://cloud.r-project.org")
)Here is the example textgrid created by Praat. It was created using
New > Create TextGrid... with default settings in
Praat.
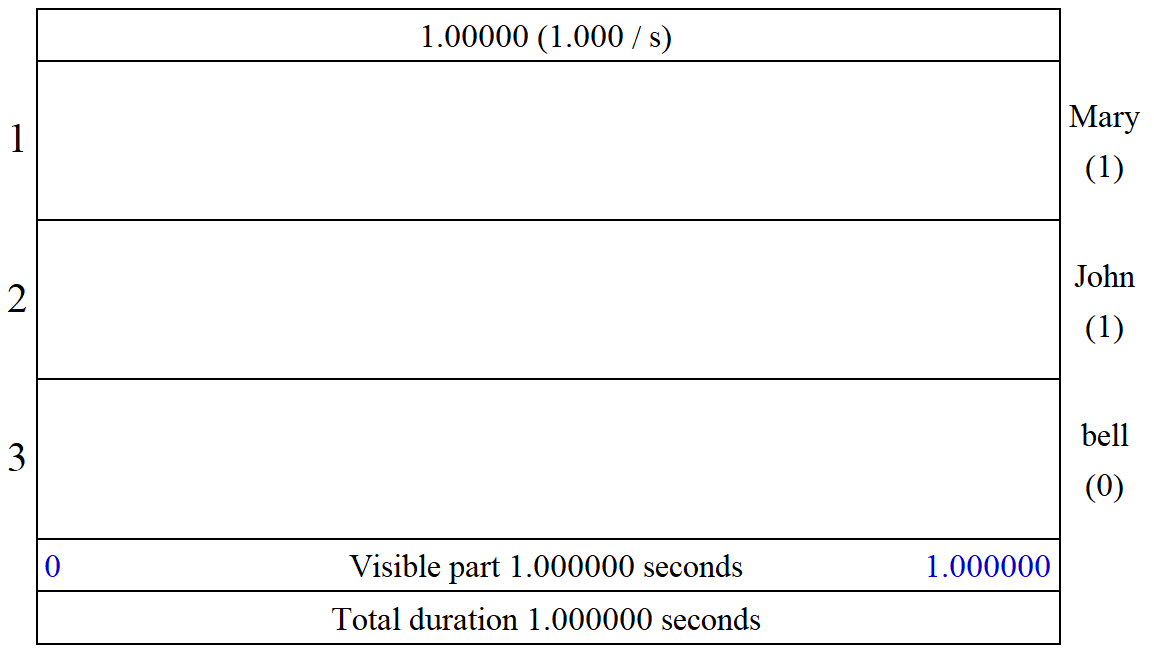
This textgrid is bundled with this R package. We can locate the file
with example_textgrid(). We read in the textgrid with
read_textgrid().
library(readtextgrid)

# Locates path to an example textgrid bundled with this package
tg <- example_textgrid()

read_textgrid(path = tg)
#> # A tibble: 3 × 10
#>   file                    tier_num tier_name tier_type    tier_xmin tier_xmax
#>   <chr>                      <int> <chr>     <chr>            <dbl>     <dbl>
#> 1 Mary_John_bell.TextGrid        1 Mary      IntervalTier         0         1
#> 2 Mary_John_bell.TextGrid        2 John      IntervalTier         0         1
#> 3 Mary_John_bell.TextGrid        3 bell      TextTier             0         1
#>    xmin  xmax text  annotation_num
#>   <dbl> <dbl> <chr>          <int>
#> 1     0     1 ""                 1
#> 2     0     1 ""                 1
#> 3    NA    NA <NA>              NA
The dataframe contains one row per annotation: one row for each
interval on an interval tier and one row for each point on a point tier.
If a point tier has no points, it is represented with single row with
NA values.
The columns encode the following information:
file filename of the textgrid. By default this column
uses the filename in path. A user can override this value
by setting the file argument in
read_textgrid(path, file), which can be useful if textgrids
are stored in speaker-specific folders.tier_num the number of the tier (as in the left margin
of Praat’s textgrid editor)tier_name the name of the tier (as in the right margin
of Praat’s textgrid editor)tier_type the type of the tier.
"IntervalTier" for interval tiers and
"TextTier" for point tiers (this is the terminology used
inside of the textgrid file format).tier_xmin, tier_xmax start and end times
of the tier in secondsxmin, xmax start and end times of the
textgrid interval or point tier annotation in secondstext the text in the annotationannotation_num the number of the annotation in that
tier (1 for the first annotation, etc.)Suppose we have data on multiple speakers with one folder of
textgrids per speaker. As an example, this package has a folder called
speaker_data bundled with it representing 5 five textgrids
from 2 speakers.
📂 speaker-data
├── 📂 speaker001
│   ├── s2T01.TextGrid
│   ├── s2T02.TextGrid
│   ├── s2T03.TextGrid
│   ├── s2T04.TextGrid
│   └── s2T05.TextGrid
└── 📂 speaker002
    ├── s2T01.TextGrid
    ├── s2T02.TextGrid
    ├── s2T03.TextGrid
    ├── s2T04.TextGrid
    └── s2T05.TextGrid
First, we create a vector of file-paths to read into R.
# Get the path of the folder bundled with the package
data_dir <- system.file(package = "readtextgrid", "speaker-data")

# Get the full paths to all the textgrids
paths <- list.files(
  path = data_dir,
  pattern = "TextGrid$",
  full.names = TRUE,
  recursive = TRUE
)
We can use purrr::map()–map the
read_textgrid() function over the paths—to
read all these textgrids into R and combine them from a list to a single
dataframe with purrr::list_rbind(). But note that this way
doesn’t track any speaker information.
library(purrr)

paths |>
  map(read_textgrid) |>
  list_rbind()
#> # A tibble: 150 × 10
#>    file           tier_num tier_name tier_type    tier_xmin tier_xmax  xmin
#>    <chr>             <int> <chr>     <chr>            <dbl>     <dbl> <dbl>
#>  1 s2T01.TextGrid        1 words     IntervalTier         0      1.35 0
#>  2 s2T01.TextGrid        1 words     IntervalTier         0      1.35 0.297
#>  3 s2T01.TextGrid        1 words     IntervalTier         0      1.35 0.522
#>  4 s2T01.TextGrid        1 words     IntervalTier         0      1.35 0.972
#>  5 s2T01.TextGrid        2 phones    IntervalTier         0      1.35 0
#>  6 s2T01.TextGrid        2 phones    IntervalTier         0      1.35 0.297
#>  7 s2T01.TextGrid        2 phones    IntervalTier         0      1.35 0.36
#>  8 s2T01.TextGrid        2 phones    IntervalTier         0      1.35 0.495
#>  9 s2T01.TextGrid        2 phones    IntervalTier         0      1.35 0.522
#> 10 s2T01.TextGrid        2 phones    IntervalTier         0      1.35 0.621
#>     xmax text    annotation_num
#>    <dbl> <chr>            <int>
#>  1 0.297 ""                   1
#>  2 0.522 "bird"               2
#>  3 0.972 "house"              3
#>  4 1.35  ""                   4
#>  5 0.297 "sil"                1
#>  6 0.36  "B"                  2
#>  7 0.495 "ER1"                3
#>  8 0.522 "D"                  4
#>  9 0.621 "HH"                 5
#> 10 0.783 "AW1"                6
#> # ℹ 140 more rows
By default, read_textgrid() uses the file basename (the
file-path minus the directory part) for the file column.
But we can manually set the file value. Here, we use
purrr::map2() to map the function over
read_textgrid(path, file) over path and
file pairs. Then we add the speaker information with some
dataframe manipulation functions.
library(dplyr)

# This tells read_textgrid() to set the file column to the full path
data <- map2(paths, paths, read_textgrid) |>
  list_rbind() |>
  mutate(
    # basename() removes the folder part from a path,
    # dirname() removes the file part from a path
    speaker = basename(dirname(file)),
    file = basename(file),
  ) |>
  select(
    speaker, everything()
  )

data
#> # A tibble: 150 × 11
#>    speaker    file           tier_num tier_name tier_type    tier_xmin tier_xmax
#>    <chr>      <chr>             <int> <chr>     <chr>            <dbl>     <dbl>
#>  1 speaker001 s2T01.TextGrid        1 words     IntervalTier         0      1.35
#>  2 speaker001 s2T01.TextGrid        1 words     IntervalTier         0      1.35
#>  3 speaker001 s2T01.TextGrid        1 words     IntervalTier         0      1.35
#>  4 speaker001 s2T01.TextGrid        1 words     IntervalTier         0      1.35
#>  5 speaker001 s2T01.TextGrid        2 phones    IntervalTier         0      1.35
#>  6 speaker001 s2T01.TextGrid        2 phones    IntervalTier         0      1.35
#>  7 speaker001 s2T01.TextGrid        2 phones    IntervalTier         0      1.35
#>  8 speaker001 s2T01.TextGrid        2 phones    IntervalTier         0      1.35
#>  9 speaker001 s2T01.TextGrid        2 phones    IntervalTier         0      1.35
#> 10 speaker001 s2T01.TextGrid        2 phones    IntervalTier         0      1.35
#>     xmin  xmax text    annotation_num
#>    <dbl> <dbl> <chr>            <int>
#>  1 0     0.297 ""                   1
#>  2 0.297 0.522 "bird"               2
#>  3 0.522 0.972 "house"              3
#>  4 0.972 1.35  ""                   4
#>  5 0     0.297 "sil"                1
#>  6 0.297 0.36  "B"                  2
#>  7 0.36  0.495 "ER1"                3
#>  8 0.495 0.522 "D"                  4
#>  9 0.522 0.621 "HH"                 5
#> 10 0.621 0.783 "AW1"                6
#> # ℹ 140 more rows
Another strategy would be to read the textgrid dataframes into a list
column and tidyr::unnest() them.
# Read dataframes into a list column
data_nested <- tibble(
  speaker = basename(dirname(paths)),
  data = map(paths, read_textgrid)
)

# We have one row per textgrid dataframe because `data` is a list column
data_nested
#> # A tibble: 10 × 2
#>    speaker    data
#>    <chr>      <list>
#>  1 speaker001 <tibble [13 × 10]>
#>  2 speaker001 <tibble [15 × 10]>
#>  3 speaker001 <tibble [16 × 10]>
#>  4 speaker001 <tibble [12 × 10]>
#>  5 speaker001 <tibble [19 × 10]>
#>  6 speaker002 <tibble [13 × 10]>
#>  7 speaker002 <tibble [15 × 10]>
#>  8 speaker002 <tibble [16 × 10]>
#>  9 speaker002 <tibble [12 × 10]>
#> 10 speaker002 <tibble [19 × 10]>

# promote the nested dataframes into the main dataframe
tidyr::unnest(data_nested, "data")
#> # A tibble: 150 × 11
#>    speaker    file  tier_num tier_name tier_type tier_xmin tier_xmax  xmin  xmax
#>    <chr>      <chr>    <int> <chr>     <chr>         <dbl>     <dbl> <dbl> <dbl>
#>  1 speaker001 s2T0…        1 words     Interval…         0      1.35 0     0.297
#>  2 speaker001 s2T0…        1 words     Interval…         0      1.35 0.297 0.522
#>  3 speaker001 s2T0…        1 words     Interval…         0      1.35 0.522 0.972
#>  4 speaker001 s2T0…        1 words     Interval…         0      1.35 0.972 1.35
#>  5 speaker001 s2T0…        2 phones    Interval…         0      1.35 0     0.297
#>  6 speaker001 s2T0…        2 phones    Interval…         0      1.35 0.297 0.36
#>  7 speaker001 s2T0…        2 phones    Interval…         0      1.35 0.36  0.495
#>  8 speaker001 s2T0…        2 phones    Interval…         0      1.35 0.495 0.522
#>  9 speaker001 s2T0…        2 phones    Interval…         0      1.35 0.522 0.621
#> 10 speaker001 s2T0…        2 phones    Interval…         0      1.35 0.621 0.783
#> # ℹ 140 more rows
#> # ℹ 2 more variables: text <chr>, annotation_num <int>In the textgrids above, there is a natural nesting or hierarchy to
the tiers. Intervals in words tier contain intervals in the
phones tier. It is often necessary to group intervals by
their parent intervals (group phones by words). This package provides
the pivot_textgrid_tiers() function to convert textgrids
into a wide format in a way that respects the nesting/hierarchy of
tiers.
data_wide <- pivot_textgrid_tiers(
  data,
  tiers = c("words", "phones"),
  join_cols = c("speaker", "file")
)

data_wide
#> # A tibble: 108 × 18
#>    speaker    file   words words_xmin words_xmax words_xmid words_annotation_num
#>    <chr>      <chr>  <chr>      <dbl>      <dbl>      <dbl>                <int>
#>  1 speaker001 s2T01… ""         0          0.297      0.149                    1
#>  2 speaker001 s2T01… "bir…      0.297      0.522      0.410                    2
#>  3 speaker001 s2T01… "bir…      0.297      0.522      0.410                    2
#>  4 speaker001 s2T01… "bir…      0.297      0.522      0.410                    2
#>  5 speaker001 s2T01… "hou…      0.522      0.972      0.747                    3
#>  6 speaker001 s2T01… "hou…      0.522      0.972      0.747                    3
#>  7 speaker001 s2T01… "hou…      0.522      0.972      0.747                    3
#>  8 speaker001 s2T01… ""         0.972      1.35       1.16                     4
#>  9 speaker001 s2T01… ""         0.972      1.35       1.16                     4
#> 10 speaker001 s2T02… ""         0          0.297      0.149                    1
#> # ℹ 98 more rows
#> # ℹ 11 more variables: words_tier_num <int>, words_tier_type <chr>,
#> #   tier_xmin <dbl>, tier_xmax <dbl>, phones <chr>, phones_xmin <dbl>,
#> #   phones_xmax <dbl>, phones_xmid <dbl>, phones_annotation_num <int>,
#> #   phones_tier_num <int>, phones_tier_type <chr>

# more clearly
data_wide |>
  select(
    speaker, file, words, phones,
    words_xmin, words_xmax, phones_xmin, phones_xmax
  )
#> # A tibble: 108 × 8
#>    speaker    file    words phones words_xmin words_xmax phones_xmin phones_xmax
#>    <chr>      <chr>   <chr> <chr>       <dbl>      <dbl>       <dbl>       <dbl>
#>  1 speaker001 s2T01.… ""    "sil"       0          0.297       0           0.297
#>  2 speaker001 s2T01.… "bir… "B"         0.297      0.522       0.297       0.36
#>  3 speaker001 s2T01.… "bir… "ER1"       0.297      0.522       0.36        0.495
#>  4 speaker001 s2T01.… "bir… "D"         0.297      0.522       0.495       0.522
#>  5 speaker001 s2T01.… "hou… "HH"        0.522      0.972       0.522       0.621
#>  6 speaker001 s2T01.… "hou… "AW1"       0.522      0.972       0.621       0.783
#>  7 speaker001 s2T01.… "hou… "S"         0.522      0.972       0.783       0.972
#>  8 speaker001 s2T01.… ""    "sp"        0.972      1.35        0.972       1.33
#>  9 speaker001 s2T01.… ""    ""          0.972      1.35        1.33        1.35
#> 10 speaker001 s2T02.… ""    "sil"       0          0.297       0           0.297
#> # ℹ 98 more rows
Some remarks:
tiers becomes a batch of columns. For the
rows for the words tier become the batch of columns
words (the original text value),
words_xmin, words_xmax, etc.join_cols should uniquely identify a
textgrid file, so the combination of speaker and
file is needed in the case where different speakers have
the same file.tiers should be given in the order of
their nesting from outside to inside (e.g., words contain
phones). Behind the scenes,
dplyr::left_join(..., relationship = "one-to-many") is used
to constrain how intervals are combined.This function also works on a single tiers value. In
this case, the function returns just the intervals in that tier with the
columns renamed and prefixed.
data |>
  pivot_textgrid_tiers(
    tiers = "words",
    join_cols = c("speaker", "file")
  )
#> # A tibble: 42 × 11
#>    speaker    file   words words_xmin words_xmax words_xmid words_annotation_num
#>    <chr>      <chr>  <chr>      <dbl>      <dbl>      <dbl>                <int>
#>  1 speaker001 s2T01… ""         0          0.297      0.149                    1
#>  2 speaker001 s2T01… "bir…      0.297      0.522      0.410                    2
#>  3 speaker001 s2T01… "hou…      0.522      0.972      0.747                    3
#>  4 speaker001 s2T01… ""         0.972      1.35       1.16                     4
#>  5 speaker001 s2T02… ""         0          0.297      0.149                    1
#>  6 speaker001 s2T02… "cow…      0.297      0.702      0.500                    2
#>  7 speaker001 s2T02… "boo…      0.702      1.17       0.936                    3
#>  8 speaker001 s2T02… ""         1.17       1.59       1.38                     4
#>  9 speaker001 s2T03… ""         0          0.369      0.184                    1
#> 10 speaker001 s2T03… "hug"      0.369      0.657      0.513                    2
#> # ℹ 32 more rows
#> # ℹ 4 more variables: words_tier_num <int>, words_tier_type <chr>,
#> # tier_xmin <dbl>, tier_xmax <dbl>Do you have thousands of textgrids to read? The following workflow can speed things up. We are going to read the textgrids in parallel. Below are two approaches:
The backend manages the parallel computation, and the frontend provides the syntax for calling a function with parallelism.
Approach 1: We tell future to use a
multisession plan for parallelism, so the
computations are done on separate R sessions in the background. The
syntax is like the above purrr code, but we replace map()
with future_map().
library(future)
library(furrr)
plan(multisession, workers = 4)

data_nested <- tibble(
  speaker = basename(dirname(paths)),
  data = future_map(paths, read_textgrid)
)
Approach 2: We have mirai set up 4 daemons
(background processes), and then we use purrr’s
in_parallel() helper to signal to map() that
the function should be run in parallel. We need to give all the
information needed for the daemons to run the function, so we 1) provide
a complete function definition (including function(x) ...)
and 2) spell out the package namespace
readtextgrid::read_textgrid().
mirai::daemons(4)
data_nested <- tibble(
  speaker = basename(dirname(paths)),
  data = map(paths, in_parallel(function(x) readtextgrid::read_textgrid(x)))
)
mirai::daemons(0)
Another way to eke out performance is to set the encoding. By
default, readtextgrid uses readr::guess_encoding() to
determine the encoding of the textgrid before reading it in. But if you
know the encoding beforehand, you can skip this guessing. In my limited
testing, I found that setting the encoding could reduce
benchmark times by 3–4% compared to guessing the encoding.
Here, we read 100 textgrids using different approaches to benchmark the results.
paths_bench <- withr::with_seed(1, sample(paths, 100, replace = TRUE))

mirai::daemons(4)
bench::mark(
  lapply_guess = lapply(paths_bench, read_textgrid),
  lapply_set   = lapply(paths_bench, read_textgrid, encoding = "UTF-8"),
  future_guess = future_map(paths_bench, read_textgrid),
  future_set   = future_map(paths_bench, read_textgrid, encoding = "UTF-8"),
  mirai_guess = purrr::map(
    paths_bench,
    in_parallel(function(x) readtextgrid::read_textgrid(x))
  ),
  mirai_set = purrr::map(
    paths_bench,
    in_parallel(function(x) readtextgrid::read_textgrid(x, encoding = "UTF-8"))
  ),
  check = TRUE
)
#> Warning: Some expressions had a GC in every iteration; so filtering is
#> disabled.
#> # A tibble: 6 × 6
#>   expression        min   median `itr/sec` mem_alloc `gc/sec`
#>   <bch:expr>   <bch:tm> <bch:tm>     <dbl> <bch:byt>    <dbl>
#> 1 lapply_guess    1.17s    1.17s     0.852   13.32MB     5.96
#> 2 lapply_set   883.69ms 883.69ms     1.13     5.41MB     6.79
#> 3 future_guess 407.83ms 421.37ms     2.37   627.53KB     2.37
#> 4 future_set   356.49ms 358.09ms     2.79   627.53KB     2.79
#> 5 mirai_guess  315.85ms 338.82ms     2.95  1006.66KB     0
#> 6 mirai_set    258.63ms 259.45ms     3.85  1006.66KB     0
mirai::daemons(0)The original version of this package assumed the textgrid text files followed a “long” format with helpful labels and annotations. For example, in the following textgrid, each number has a label that makes it easy and fast to parse the textgrid with regular expressions:
File type = "ooTextFile"
Object class = "TextGrid"

xmin = 0
xmax = 1
tiers? <exists>
size = 1
item []:
    item [1]:
        class = "IntervalTier"
        name = "Mary"
        xmin = 0
        xmax = 1
        intervals: size = 1
        intervals [1]:
            xmin = 0
            xmax = 1
            text = ""
The original version of the parser designed for this textgrid format
is still provided with the legacy_read_textgrid() and
legacy_read_textgrid_lines() functions.
Version 0.2.0 of readtextgrid added a C++ based parser that can handle many more textgrid formats. For example, it can “short” format textgrids like the following:
File type = "ooTextFile"
Object class = "TextGrid"

0
1
<exists>
1
"IntervalTier"
"Mary"
0
1
1
0
1
""
The “long” format textgrids are outputted in Praat with
Save > Save as text file..., and the “short” format
textgrids are outputted with
Save > Save as short textfile....
readtextgrid’s parser can also handle esoteric
features like comments (that start with !) or arbitrary
text attached to a number, as in the following example;:
File type = "ooTextFile"
Object class = "TextGrid"

! info about the grid
0s 1s <exists> 1
! info about the tier
"IntervalTier" "Mary" 0s 1s 1 ! type, name, xmin, xmax, size
0s 1s "" ! interval xmin, xmax, size
Because the new parser uses C++ for tokenization—that is, the part scans the contents character by character and determines whether the inputs are strings, numbers, or skipped—it is much faster the legacy version.
paths_bench <- withr::with_seed(2, sample(paths, 10, replace = TRUE))

bench::mark(
  current = lapply(paths_bench, read_textgrid),
  legacy = lapply(paths_bench, legacy_read_textgrid),
  min_iterations = 10,
  filter_gc = FALSE,
  check = TRUE
)
#> # A tibble: 2 × 6
#>   expression      min   median `itr/sec` mem_alloc `gc/sec`
#>   <bch:expr> <bch:tm> <bch:tm>     <dbl> <bch:byt>    <dbl>
#> 1 current       114ms    123ms      8.11    1.31MB     4.86
#> 2 legacy 332ms 342ms 2.89 19.57MB 6.06The following columns are often helpful:
duration of an intervalxmid midpoint of an intervaltotal_annotations total number of annotations on a
tierHere is how to create them:
data |>
  # grouping needed for counting annotations per tier per file per speaker
  group_by(speaker, file, tier_num) |>
  mutate(
    duration = xmax - xmin,
    xmid = xmin + (xmax - xmin) / 2,
    total_annotations = sum(!is.na(annotation_num))
  ) |>
  ungroup() |>
  glimpse()
#> Rows: 150
#> Columns: 14
#> $ speaker           <chr> "speaker001", "speaker001", "speaker001", "speaker00…
#> $ file              <chr> "s2T01.TextGrid", "s2T01.TextGrid", "s2T01.TextGrid"…
#> $ tier_num          <int> 1, 1, 1, 1, 2, 2, 2, 2, 2, 2, 2, 2, 2, 1, 1, 1, 1, 2…
#> $ tier_name         <chr> "words", "words", "words", "words", "phones", "phone…
#> $ tier_type         <chr> "IntervalTier", "IntervalTier", "IntervalTier", "Int…
#> $ tier_xmin         <dbl> 0, 0, 0, 0, 0, 0, 0, 0, 0, 0, 0, 0, 0, 0, 0, 0, 0, 0…
#> $ tier_xmax         <dbl> 1.348571, 1.348571, 1.348571, 1.348571, 1.348571, 1.…
#> $ xmin              <dbl> 0.000, 0.297, 0.522, 0.972, 0.000, 0.297, 0.360, 0.4…
#> $ xmax              <dbl> 0.297000, 0.522000, 0.972000, 1.348571, 0.297000, 0.…
#> $ text              <chr> "", "bird", "house", "", "sil", "B", "ER1", "D", "HH…
#> $ annotation_num    <int> 1, 2, 3, 4, 1, 2, 3, 4, 5, 6, 7, 8, 9, 1, 2, 3, 4, 1…
#> $ duration          <dbl> 0.29700000, 0.22500000, 0.45000000, 0.37657143, 0.29…
#> $ xmid              <dbl> 0.148500, 0.409500, 0.747000, 1.160286, 0.148500, 0.…
#> $ total_annotations <int> 4, 4, 4, 4, 9, 9, 9, 9, 9, 9, 9, 9, 9, 4, 4, 4, 4, 1…This tip is written from the perspective of a Windows user who uses git bash for a terminal.
To open textgrids in Praat, you can tell R to call Praat from the
command line. You have to know where the location of the Praat binary is
though. I like to keep a copy in my project directories. So, assuming
that Praat.exe in my working folder, the following would open the 10
textgrids in paths in Praat.
system2(
  command = "./Praat.exe",
  args = c("--open", paths),
  wait = FALSE
)readtextgrid was created to process data from the WISC Lab project. Thus, development of this package was supported by NIH R01DC009411 and NIH R01DC015653.
Please note that the ‘readtextgrid’ project is released with a Contributor Code of Conduct. By contributing to this project, you agree to abide by its terms.