The goal of metaggR is to provide easy access to the
knowledge-weighted estimate proposed in Palley
and Satopää (2021).
You can install the released version of metaggR from CRAN with:
install.packages("metaggR")This section illustrates metaggR on the Three Gorges Dam
example in Palley
and Satopää (2021).
library(metaggR)
# Judges' estimates:
E1 = c(50, 134, 206, 290, 326, 374)
# Judges' predictions of others:
P1 = c(26, 92, 116, 218, 218, 206)
# Knowledge-weighted estimate:
knowledge_weighted_estimate(E1,P1)
#> [1] 329.305
Therefore the final knowledge-weighted estimate is 329.305
Next, we will illustrate the outlier-robust version of the knowledge-weighted estimate. We augment the simple Three Gorges Dam example with a 7th judge with an extreme response:
# Judges' estimates (augmented):
E2 = c(50, 134, 206, 290, 326, 374, 1000)
# Judges' predictions of others (augmented):
P2 = c(26, 92, 116, 218, 218, 206, 400)
# Knowledge-weighted estimate:
knowledge_weighted_estimate(E2,P2)
#> [1] 630.0491
The knowledge-weighted estimate is now 630.0491, which is much higher than the previous 329.305. Clearly this aggregate estimate is driven largely by the 7th judge. We inspect the crowd for highly influential judges:
get_influence_scores(E2,P2, plotIt = TRUE)
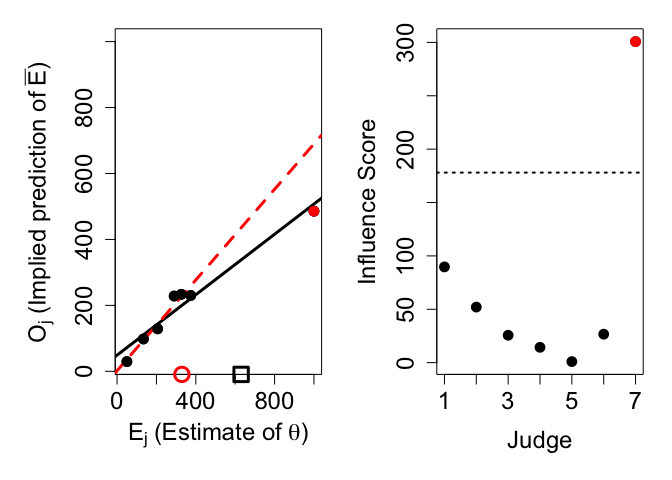
#> [1]  89.6910974  52.0441977  25.6565467  14.3443785   0.9792417  26.6575698
#> [7] 300.7440879
The output prints the influence scores for each judge. Intuitively, an influence score shows how much the knowledge-weighted estimate would change if that judge was removed from the crowd. Our analysis shows that judge 7 is highly influential, with an influence score of around 300. Compare this to the influence scores of judges 1-6. They are all smaller than 90 and hence much smaller than judge 7’s influence score.
The function call also produces two plots. The left plot is a scatter plot of the judges’ estimates against the judges’ implied predictions of others. This plot includes regression lines both with (solid black) and without (dashed red) the exceptionally influential judges. All exceptionally influential judges are shown in red. The knowledge-weighted estimate is shown both with (black square) and without (red circle) exceptionally influential judges. The right plot shows the judges’ influence scores. All exceptionally influential judges are shown in red. The dashed horizontal line represents the threshold, defined as the user-defined cutoff value x the interquartile range of all influence scores.
To remove influential judges’ estimates from the knowledge-weighted estimate, we calculate the interquartile range (IQR) of the individual influence scores and remove a judge if that judge’s influence score is larger than some user-defined cutoff times IQR. Using the default cutoff of 7/2 on the augmented Three Gorges Dam example gives us the original knowledge-weighted estimate of 329.305:
knowledge_weighted_estimate(E2,P2,cutoff=7/2,remove_inf=TRUE)
#> [1] 329.305