The gitlab version of the malariaAtlas package has some additional bugfixes over the stable CRAN package. If you have any issues, try installing the latest github version. See below for instructions.
This package allows you to download parasite rate data (Plasmodium falciparum and P. vivax), survey occurrence data of the 41 dominant malaria vector species, and modelled raster outputs from the Malaria Atlas Project.
More details and example analyses can be found in the [published paper)[(https://link.springer.com/article/10.1186/s12936-018-2500-5).
The data can be explored at https://data.malariaatlas.org/maps.
The list version functions are used to list the available versions of
different datasets, and all return a data.frame with a single column for
version. These versions can be passed to functions such as
listShp, listSpecies,
listPRPointCountries,
listVecOccPointCountries, getPR,
getVecOcc and getShp.
Use:
listPRPointVerions() to see the available versions
for PR point data, which can then be used in
listPRPointCountries and getPR.
listVecOccPointVersions() to see the available
versions for vector occurrence data, which can then be used in
listSpecies, listVecOccPointCountries and
getVecOcc.
listShpVersions() to see the available versions for
admin unit shape data, which can then be used in listShp
and getShp.
listPRPointVersions()listVecOccPointVersions()listShpVersions()To list the countries where there is available data for PR points or vector occurrence points, use:
listPRPointCountries() for PR pointslistVecOccPointCountries() for vector occurrence
pointsTo list the species available for vector point data use
listSpecies()
All three of these functions can optionally take a version parameter (which can be found with the list versions functions). If you choose not to provide a version, the most recent version of the relevant dataset will be selected by default.
listPRPointCountries(version = "202206")listVecOccPointCountries(version = "201201")listSpecies(version = "201201")To list administrative units for which shapefiles are stored on the
MAP geoserver, use listShp(). Similar to the list countries
and species functions, this function can optionally take a version.
listShp(version = "202206")listRaster() gets minimal information on all available
rasters. It returns a data.frame with several columns for each raster
such as dataset_id, title, abstract, min_raster_year and
max_raster_year. The dataset_id can then be used in
getRaster and extractRaster.
listRaster()isAvailable_pr confirms whether or not PR survey point
data is available to download for a specified country, ISO3 code or
continent.
Check whether PR data is available for Madagascar:
isAvailable_pr(country = "Madagascar")Check whether PR data is available for the United States of America by ISO code:
isAvailable_pr(ISO = "USA")Check whether PR data is available for Asia:
isAvailable_pr(continent = "Asia")isAvailable_vec confirms whether or not vector survey
point data is available to download for a specified country, ISO3 code
or continent.
Check whether vector data is available for Myanmar:
isAvailable_vec(country = "Myanmar")Check whether vector data is available for multiple countries:
isAvailable_vec(country = c("Nigeria", "Ethiopia"))You can also pass these functions a dataset version. If you don’t they will default to using the most recent version.
isAvailable_pr(country = "Madagascar", version = "202206")getPR() downloads all publicly available PR data points
for a specified location (country, ISO, continent or extent) and
plasmodium species (Pf, Pv or BOTH) and returns this as a dataframe with
the following format:
MDG_pr_data <- getPR(country = "Madagascar", species = "both")## Rows: 2,298
## Columns: 28
## $ dhs_id <chr> NA, NA, NA, NA, NA, NA, NA, NA, NA, NA, NA, NA, NA, NA, NA, NA, NA, NA, NA,…
## $ site_id <int> 8689, 6221, 18093, 6021, 15070, 15795, 7374, 13099, 9849, 11961, 21475, 115…
## $ site_name <chr> "Vodivohitra", "Andranomasina", "Ankazobe", "Andasibe", "Ambohimarina", "An…
## $ latitude <dbl> -16.21700, -18.71700, -18.31600, -19.83400, -18.73400, -19.76990, -25.03230…
## $ longitude <dbl> 49.68300, 47.46600, 47.11800, 47.85000, 47.25200, 46.68700, 46.99600, 47.16…
## $ rural_urban <chr> "RURAL", "UNKNOWN", "RURAL", "UNKNOWN", "UNKNOWN", "UNKNOWN", "UNKNOWN", "U…
## $ country <chr> "Madagascar", "Madagascar", "Madagascar", "Madagascar", "Madagascar", "Mada…
## $ country_id <chr> "MDG", "MDG", "MDG", "MDG", "MDG", "MDG", "MDG", "MDG", "MDG", "MDG", "MDG"…
## $ continent_id <chr> "Africa", "Africa", "Africa", "Africa", "Africa", "Africa", "Africa", "Afri…
## $ month_start <int> 11, 1, 11, 3, 1, 7, 4, 1, 1, 2, 7, 11, 4, 7, 11, 4, 9, 7, 7, 3, 7, 7, 7, 11…
## $ year_start <int> 1989, 1987, 1989, 1987, 1987, 1995, 1986, 1987, 1987, 2003, 1995, 1989, 198…
## $ month_end <int> 11, 1, 12, 3, 1, 8, 6, 1, 1, 2, 8, 12, 4, 8, 11, 6, 9, 8, 8, 6, 7, 7, 7, 12…
## $ year_end <int> 1989, 1987, 1989, 1987, 1987, 1995, 1986, 1987, 1987, 2003, 1995, 1989, 198…
## $ lower_age <dbl> 5, 0, 5, 0, 0, 2, 7, 0, 0, 0, 2, 5, 6, 2, 2, 7, 0, 2, 2, 0, 2, 0, 0, 5, 0, …
## $ upper_age <int> 15, 99, 15, 99, 99, 9, 22, 99, 99, 99, 9, 15, 12, 9, 9, 22, 99, 9, 9, 5, 9,…
## $ examined <int> 165, 50, 258, 246, 50, 50, 119, 50, 50, 210, 50, 340, 20, 50, 61, 156, 104,…
## $ positive <dbl> 144.0, 7.5, 139.0, 126.0, 2.5, 6.0, 37.0, 13.5, 4.5, 34.0, 11.5, 255.0, 8.0…
## $ pr <dbl> 0.87272727, 0.15000000, 0.53875969, 0.51219512, 0.05000000, 0.12000000, 0.3…
## $ species <chr> "P. falciparum", "P. falciparum", "P. falciparum", "P. falciparum", "P. fal…
## $ method <chr> "Microscopy", "Microscopy", "Microscopy", "Microscopy", "Microscopy", "Micr…
## $ rdt_type <chr> NA, NA, NA, NA, NA, NA, NA, NA, NA, NA, NA, NA, NA, NA, NA, NA, NA, NA, NA,…
## $ pcr_type <chr> NA, NA, NA, NA, NA, NA, NA, NA, NA, NA, NA, NA, NA, NA, NA, NA, NA, NA, NA,…
## $ malaria_metrics_available <lgl> TRUE, TRUE, TRUE, TRUE, TRUE, TRUE, TRUE, TRUE, TRUE, TRUE, TRUE, TRUE, TRU…
## $ location_available <lgl> TRUE, TRUE, TRUE, TRUE, TRUE, TRUE, TRUE, TRUE, TRUE, TRUE, TRUE, TRUE, TRU…
## $ permissions_info <chr> NA, NA, NA, NA, NA, NA, NA, NA, NA, NA, NA, NA, NA, NA, NA, NA, NA, NA, NA,…
## $ citation1 <chr> "Lepers, J.P. (1989). <i>Rapport sur la situation du paludisme dans la régi…
## $ citation2 <chr> NA, NA, NA, NA, NA, NA, NA, NA, NA, NA, NA, NA, NA, NA, NA, NA, NA, NA, NA,…
## $ citation3 <chr> NA, NA, NA, NA, NA, NA, NA, NA, NA, NA, NA, NA, NA, NA, NA, NA, NA, NA, NA,…Africa_pvpr_data <- getPR(continent = "Africa", species = "Pv")Extent_pfpr_data <- getPR(extent = rbind(c(-2.460181, 13.581921), c(-3.867188, 34.277344)), species = "Pf")You can also pass this function a dataset version. If you don’t it will default to using the most recent version.
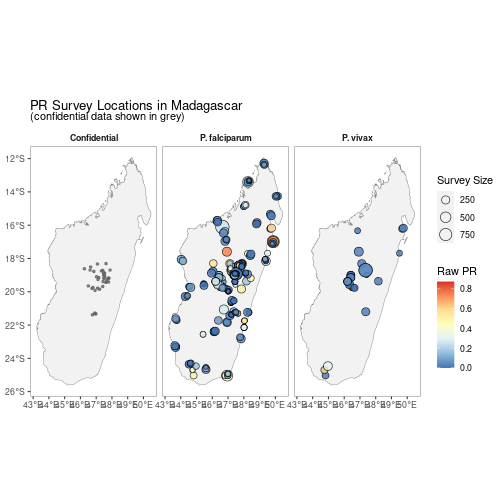
MDG_pr_data_202206 <- getPR(country = "Madagascar", species = "both", version = "202206")autoplot.pr.points configures autoplot method to enable
quick mapping of the locations of downloaded PR points.
autoplot(MDG_pr_data)A version without facetting is also available.
autoplot(MDG_pr_data,
         facet = FALSE)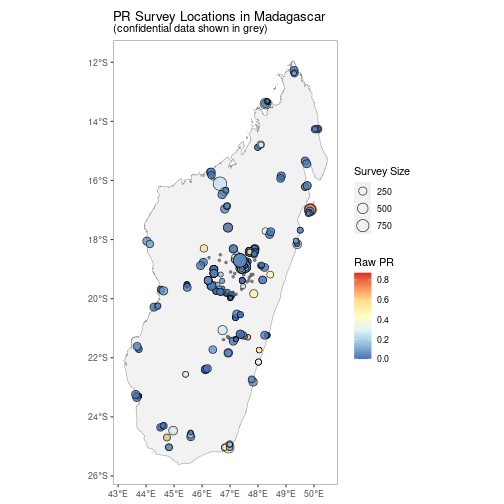
getVecOcc() downloads all publicly available Vector
survey points for a specified location (country, ISO, continent or
extent) and species (options for which can be found with
listSpecies) and returns this as a dataframe with the
following format:
MMR_vec_data <- getVecOcc(country = "Myanmar")## Rows: 2,866
## Columns: 25
## $ id <int> 1945, 1946, 1951, 1952, 790, 781, 772, 791, 773, 783, 774, 776, 777, 792, 778, 779, 78…
## $ site_id <int> 30243, 30243, 30243, 30243, 1000000072, 1000000071, 1000000071, 1000000072, 1000000071…
## $ latitude <dbl> 16.2570, 16.2570, 16.2570, 16.2570, 17.3500, 17.3800, 17.3800, 17.3500, 17.3800, 17.38…
## $ longitude <dbl> 97.7250, 97.7250, 97.7250, 97.7250, 96.0410, 96.0370, 96.0370, 96.0410, 96.0370, 96.03…
## $ country <chr> "Myanmar", "Myanmar", "Myanmar", "Myanmar", "Myanmar", "Myanmar", "Myanmar", "Myanmar"…
## $ country_id <chr> "MMR", "MMR", "MMR", "MMR", "MMR", "MMR", "MMR", "MMR", "MMR", "MMR", "MMR", "MMR", "M…
## $ continent_id <chr> "Asia", "Asia", "Asia", "Asia", "Asia", "Asia", "Asia", "Asia", "Asia", "Asia", "Asia"…
## $ month_start <int> 2, 3, 8, 9, 5, 5, 5, 5, 5, 5, 5, 5, 5, 5, 5, 5, 5, 10, 5, 5, 5, 5, 5, 5, 5, 5, 5, 5, 5…
## $ year_start <int> 1998, 1998, 1998, 1998, 1998, 1998, 1998, 1998, 1998, 1998, 1998, 1998, 1998, 1998, 19…
## $ month_end <int> 2, 3, 8, 9, 3, 3, 3, 3, 3, 3, 3, 3, 3, 3, 3, 3, 3, 10, 3, 3, 3, 3, 3, 3, 3, 3, 3, 3, 3…
## $ year_end <int> 1998, 1998, 1998, 1998, 2000, 2000, 2000, 2000, 2000, 2000, 2000, 2000, 2000, 2000, 20…
## $ anopheline_id <int> 17, 17, 17, 17, 50, 49, 17, 51, 11, 4, 15, 1, 35, 30, 50, 51, 30, 17, 17, 11, 15, 1, 3…
## $ species <chr> "Anopheles dirus species complex", "Anopheles dirus species complex", "Anopheles dirus…
## $ species_plain <chr> "Anopheles dirus", "Anopheles dirus", "Anopheles dirus", "Anopheles dirus", "Anopheles…
## $ id_method1 <chr> "unknown", "unknown", "unknown", "unknown", "morphology", "morphology", "morphology", …
## $ id_method2 <chr> NA, NA, NA, NA, NA, NA, NA, NA, NA, NA, NA, NA, NA, NA, NA, NA, NA, NA, NA, NA, NA, NA…
## $ sample_method1 <chr> "man biting", "man biting", "man biting", "man biting", "man biting indoors", "man bit…
## $ sample_method2 <chr> "animal baited net trap", "animal baited net trap", "animal baited net trap", "animal …
## $ sample_method3 <chr> NA, NA, NA, NA, "animal baited net trap", "animal baited net trap", "animal baited net…
## $ sample_method4 <chr> NA, NA, NA, NA, "house resting inside", "house resting inside", "house resting inside"…
## $ assi <chr> "", "", "", "", "", "", "", "", "", "", "", "", "", "", "", "", "", "", "", "", "", ""…
## $ citation <chr> "Oo, T.T., Storch, V. and Becker, N. (2003). <b><i>Anopheles</i> <i>dirus</i> and its…
## $ time_start <date> 1998-02-01, 1998-03-01, 1998-08-01, 1998-09-01, 1998-05-01, 1998-05-01, 1998-05-01, 1…
## $ time_end <date> 1998-02-01, 1998-03-01, 1998-08-01, 1998-09-01, 2000-03-01, 2000-03-01, 2000-03-01, 2…
## $ geometry <POINT [°]> POINT (97.725 16.257), POINT (97.725 16.257), POINT (97.725 16.257), POINT (97.7…You can also pass this function a dataset version. If you don’t it will default to using the most recent version.
MMR_vec_data_201201 <- getVecOcc(country = "Myanmar", version = "201201")autoplot.vector.points configures autoplot method to
enable quick mapping of the locations of downloaded vector points.
autoplot(MMR_vec_data)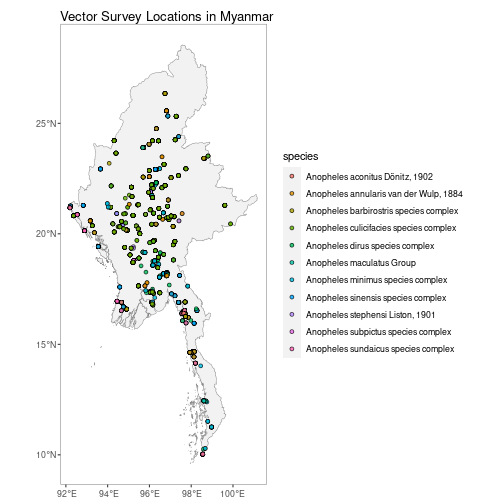
N.B. Facet-wrapped option is also available for species stratification.
autoplot(MMR_vec_data,
         facet = TRUE)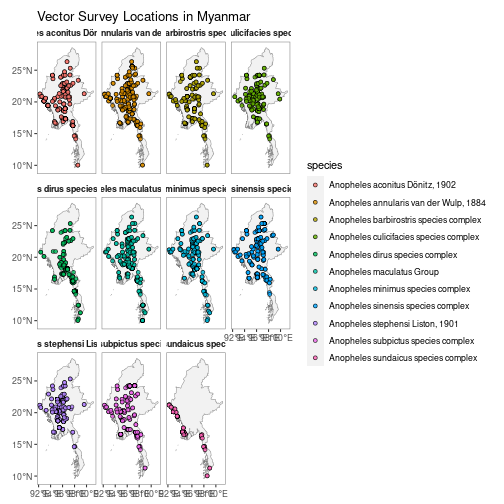
getShp() downloads a shapefile for a specified country
(or countries) and returns this as a simple feature object.
MDG_shp <- getShp(ISO = "MDG", admin_level = c("admin0", "admin1"))## Rows: 23
## Columns: 17
## $ iso <chr> "MDG", "MDG", "MDG", "MDG", "MDG", "MDG", "MDG", "MDG", "MDG", "MDG", "MDG", "MDG", "MD…
## $ admn_level <int> 0, 1, 1, 1, 1, 1, 1, 1, 1, 1, 1, 1, 1, 1, 1, 1, 1, 1, 1, 1, 1, 1, 1
## $ name_0 <chr> "Madagascar", "Madagascar", "Madagascar", "Madagascar", "Madagascar", "Madagascar", "Ma…
## $ id_0 <int> 10000910, 10000910, 10000910, 10000910, 10000910, 10000910, 10000910, 10000910, 1000091…
## $ type_0 <chr> "Country", "Country", "Country", "Country", "Country", "Country", "Country", "Country",…
## $ name_1 <chr> NA, "Menabe", "Alaotra Mangoro", "Amoron I Mania", "Analamanga", "Analanjirofo", "Andro…
## $ id_1 <int> NA, 10023004, 10022998, 10022989, 10022983, 10022999, 10023001, 10023002, 10023003, 100…
## $ type_1 <chr> NA, "Region", "Region", "Region", "Region", "Region", "Region", "Region", "Region", "Re…
## $ name_2 <lgl> NA, NA, NA, NA, NA, NA, NA, NA, NA, NA, NA, NA, NA, NA, NA, NA, NA, NA, NA, NA, NA, NA,…
## $ id_2 <lgl> NA, NA, NA, NA, NA, NA, NA, NA, NA, NA, NA, NA, NA, NA, NA, NA, NA, NA, NA, NA, NA, NA,…
## $ type_2 <lgl> NA, NA, NA, NA, NA, NA, NA, NA, NA, NA, NA, NA, NA, NA, NA, NA, NA, NA, NA, NA, NA, NA,…
## $ name_3 <lgl> NA, NA, NA, NA, NA, NA, NA, NA, NA, NA, NA, NA, NA, NA, NA, NA, NA, NA, NA, NA, NA, NA,…
## $ id_3 <lgl> NA, NA, NA, NA, NA, NA, NA, NA, NA, NA, NA, NA, NA, NA, NA, NA, NA, NA, NA, NA, NA, NA,…
## $ type_3 <lgl> NA, NA, NA, NA, NA, NA, NA, NA, NA, NA, NA, NA, NA, NA, NA, NA, NA, NA, NA, NA, NA, NA,…
## $ source <chr> "Madagascar NMCP 2016", "Madagascar NMCP 2016", "Madagascar NMCP 2016", "Madagascar NMC…
## $ country_level <chr> "MDG_0", "MDG_1", "MDG_1", "MDG_1", "MDG_1", "MDG_1", "MDG_1", "MDG_1", "MDG_1", "MDG_1…
## $ geometry <MULTIPOLYGON [°]> MULTIPOLYGON (((44.2278 -25..., MULTIPOLYGON (((43.5868 -21..., MULTIPOLYGON (((48.2394…autoplot.sf configures autoplot method to enable quick
mapping of downloaded shapefiles.
autoplot(MDG_shp)
N.B. Facet-wrapped option is also available for species stratification.
autoplot(MDG_shp,
         facet = TRUE,
         map_title = "Example of facetted shapefiles.")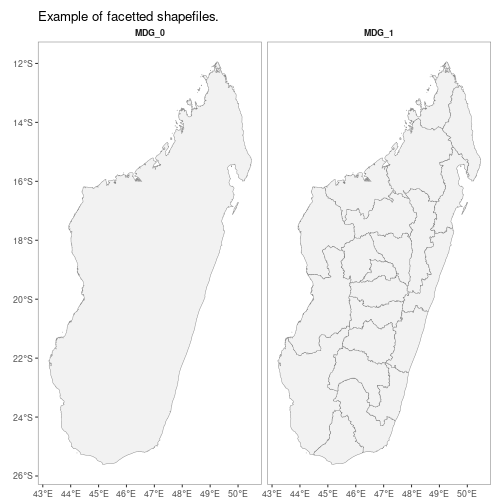
getRaster()downloads publicly available MAP rasters for
a specific dataset_id & year, clipped to a given bounding box or
shapefile
MDG_shp <- getShp(ISO = "MDG", admin_level = "admin0")
MDG_PfPR2_10 <- getRaster(dataset_id = "Explorer__2020_Global_PfPR", shp = MDG_shp, year = 2013)
autoplot.SpatRaster &
autoplot.SpatRasterCollection configures autoplot method to
enable quick mapping of downloaded rasters.
p <- autoplot(MDG_PfPR2_10, shp_df = MDG_shp)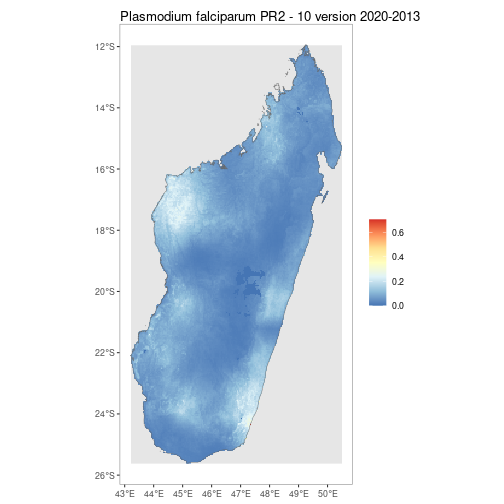
By using the above tools along with ggplot, simple comparison figures can be easily produced.
MDG_shp <- getShp(ISO = "MDG", admin_level = "admin0")
MDG_PfPR2_10 <- getRaster(dataset_id = "Explorer__2020_Global_PfPR", shp = MDG_shp, year = 2013)

p <- autoplot(MDG_PfPR2_10, shp_df = MDG_shp, printed = FALSE)

pr <- getPR(country = c("Madagascar"), species = "Pf")
p[[1]] +
  geom_point(data = pr[pr$year_start==2013,], aes(longitude, latitude, fill = positive / examined, size = examined), shape = 21) +
  scale_size_continuous(name = "Survey Size") +
  scale_fill_distiller(name = "PfPR", palette = "RdYlBu") +
  ggtitle("Raw PfPR Survey points\n + Modelled PfPR 2-10 in Madagascar in 2013")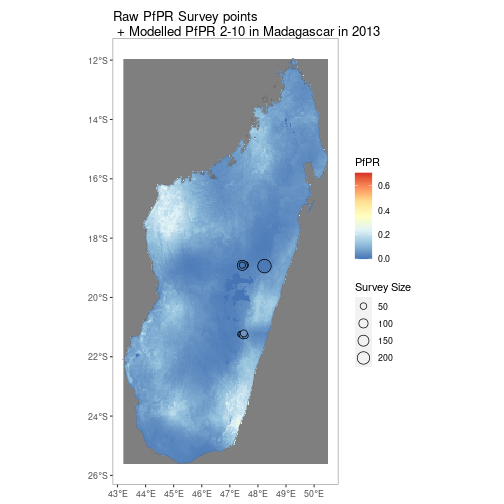
Similarly for vector survey data
MMR_shp <- getShp(ISO = "MMR", admin_level = "admin0")
MMR_An_dirus <- getRaster(dataset_id = "Explorer__2010_Anopheles_dirus_complex", shp = MMR_shp)

p <- autoplot(MMR_An_dirus, shp_df = MMR_shp, printed = FALSE)

vec <- getVecOcc(country = c("Myanmar"), species = "Anopheles dirus")
p[[1]] +
  geom_point(data = vec, aes(longitude, latitude, colour = species)) +
  scale_colour_manual(values = "black", name = "Vector survey locations") +
  scale_fill_distiller(name = "Predicted distribution of An. dirus complex", palette = "PuBuGn", direction = 1) +
  ggtitle("Vector Survey points\n + The predicted distribution of An. dirus complex")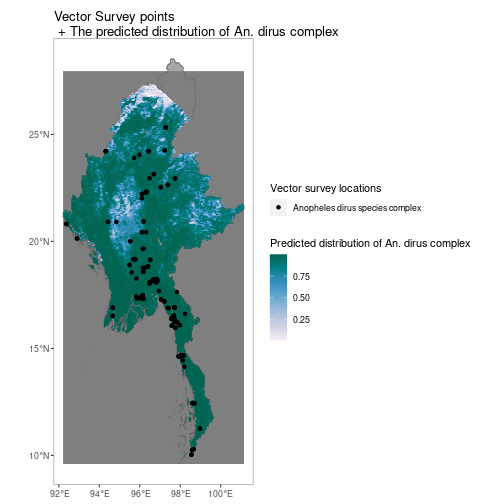
Just install using install.packages("malariaAtlas") or
using the package manager in RStudio.
While this version is not as well-tested, it may include additional
bugfixes not in the stable CRAN version. Install the
devtools package and then install using
devtools::install_github('malaria-atlas-project/malariaAtlas')