This package contains the Maddison Project Database, which contains estimates of GDP per capita for all countries in the world between AD 1 and 2016, in a format amenable to analysis in R.
The database was last updated in 2018.
As per instructions on the Maddison Project website, please site the data as follows:
Attribution requirement - When using these data (for whatever purpose), please make the following reference: - Maddison Project Database, version 2018. Bolt, Jutta, Robert Inklaar, Herman de Jong and Jan Luiten van Zanden (2018), “Rebasing ‘Maddison’: new income comparisons and the shape of long-run economic development”, Maddison Project Working paper 10 - For the references to the original research on individual countries, see Appendix A of Bolt et al. (2018).
# to install from Github
install.packages("remotes")
remotes::install_github("expersso/maddison")library(maddison)
str(maddison)## Classes 'tbl_df', 'tbl' and 'data.frame': 19873 obs. of 12 variables:
## $ countrycode: chr "AFG" "AFG" "AFG" "AFG" ...
## $ country : chr "Afghanistan" "Afghanistan" "Afghanistan" "Afghanistan" ...
## $ year : num 1820 1870 1913 1950 1951 ...
## $ cgdppc : num NA NA NA 2392 2422 ...
## $ rgdpnapc : num NA NA NA 2392 2422 ...
## $ pop : num 3280 4207 5730 8150 8284 ...
## $ i_cig : chr NA NA NA "Extrapolated" ...
## $ i_bm : chr NA NA NA NA ...
## $ iso2c : chr "AF" "AF" "AF" "AF" ...
## $ iso3c : chr "AFG" "AFG" "AFG" "AFG" ...
## $ continent : chr "Asia" "Asia" "Asia" "Asia" ...
## $ region : chr "Southern Asia" "Southern Asia" "Southern Asia" "Southern Asia" ...head(maddison)## countrycode country year cgdppc rgdpnapc pop i_cig i_bm iso2c
## 1 AFG Afghanistan 1820 NA NA 3280 <NA> <NA> AF
## 2 AFG Afghanistan 1870 NA NA 4207 <NA> <NA> AF
## 3 AFG Afghanistan 1913 NA NA 5730 <NA> <NA> AF
## 4 AFG Afghanistan 1950 2392 2392 8150 Extrapolated <NA> AF
## 5 AFG Afghanistan 1951 2422 2422 8284 Extrapolated <NA> AF
## 6 AFG Afghanistan 1952 2462 2462 8425 Extrapolated <NA> AF
## iso3c continent region
## 1 AFG Asia Southern Asia
## 2 AFG Asia Southern Asia
## 3 AFG Asia Southern Asia
## 4 AFG Asia Southern Asia
## 5 AFG Asia Southern Asia
## 6 AFG Asia Southern Asialibrary(ggplot2)
library(dplyr)
library(scales)
# Data frame with annotations
df_annotate <- data.frame(
xmin = c(1914, 1939),
xmax = c(1918, 1945),
ymin = c(900, 900), ymax = c(3e4, 3e4),
label = c("WW1", "WW2"))
maddison %>%
filter(iso2c %in% c("DE", "FR", "IT", "UK", "US")) %>%
filter(year >= 1800) %>%
ggplot() +
geom_rect(aes(xmin = xmin, xmax = xmax, ymin = ymin, ymax = ymax),
data = df_annotate, fill = "grey50", alpha = 0.25) +
geom_text(aes(label = label, x = xmin, y = ymax), data = df_annotate,
vjust = 0, hjust = 0, nudge_y = 0.02, size = 3) +
geom_line(aes(x = year, y = rgdpnapc, color = country)) +
scale_y_log10(labels = comma, breaks = pretty_breaks(8)) +
theme_bw(8) +
labs(x = NULL, y = "GDP per capita (2011 US$)\n", color = NULL,
title = "GDP per capita (1800-2016)")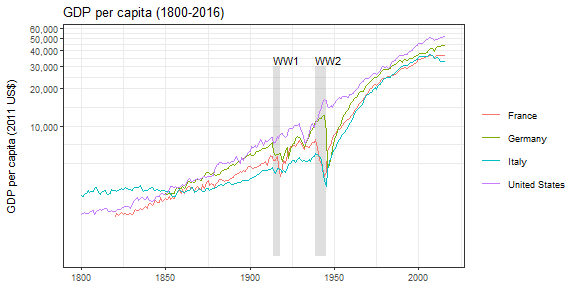
This package is not affiliated with, nor endorsed by, the Maddison Project. I aim to update it whenever the database is updated. If you ever see that it is out-of-date, don’t hesitate to send a pull request and/or remind me to update it.