![]()
The goal of iscoCrosswalks is to map indicators and raw counts from the International Standard Classification of Occupations (ISCO) to the Standard Occupational Classification (SOC) System, and vice versa.
You can install the development version of iscoCrosswalks from GitHub with:
# install.packages("devtools")
devtools::install_github("eworx-org/iscoCrosswalks")This is a basic example which shows you how to translate CEDEFOPs “Importance of foundation skills” indicator given in ISCO(2008) to SOC(2010) classification:
library(iscoCrosswalks)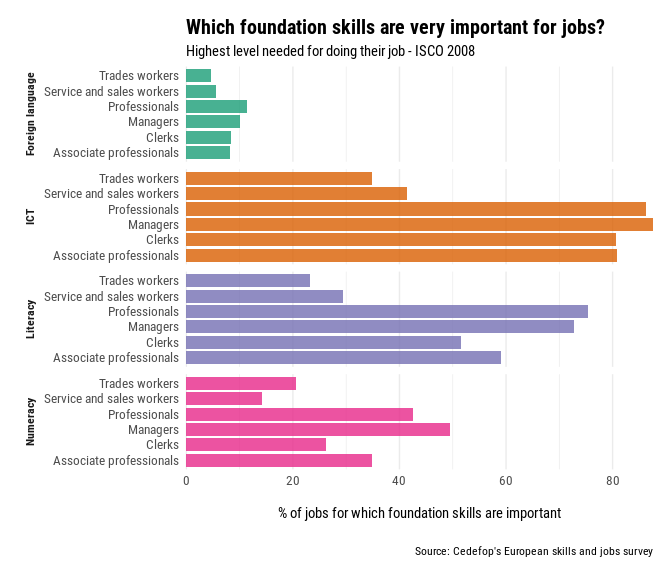
The percentage of jobs where foundation skills (literacy, numeracy, ICT, and foreign languages) are highly crucial for doing the work is shown in this indicator. It is based on the findings of Cedefop’s European survey of skills and jobs.
The Skills Foundation Indicator is exposed also in
iscoCrosswalks as an example data-set. It consists of three
variables
OccupationsSkillValueTo perform the transformation, we’ve added a third column with the
preferredLabel from the ISCO taxonomy. In the R terminal,
type isco to access the desired labels. Manual entry of
preferred labels is suggested for small data. See also the R package labourR for
automating the occupations coding, in case of big data-sets.
Inspecting the indicator,
knitr::kable(foundation_skills[seq(1 , nrow(foundation_skills), by = 5), ])| Occupations | preferredLabel | Skill | Value |
|---|---|---|---|
| Managers | Managers | Foreign language | 10.10 |
| Professionals | Professionals | ICT | 86.28 |
| Associate professionals | Technicians and associate professionals | Literacy | 59.06 |
| Clerks | Clerical support workers | Numeracy | 26.30 |
| Farm and related workers | Skilled agricultural, forestry and fishery workers | Foreign language | 1.78 |
| Trades workers | Craft and related trades workers | ICT | 34.80 |
| Operators and assemblers | Plant and machine operators and assemblers | Literacy | 18.93 |
| Elementary workers | Elementary occupations | Numeracy | 7.20 |
To translate the indicator to SOC classification,
iscoCrosswalks has two mandatory column names. Namely,
job and value standing for the preferred
labels of the taxonomy and the value of the indicator respectively.
Thus, we rename preferredLabel to job, and
Value to value.
data.table::setnames(foundation_skills,
                     c("preferredLabel", "Value"),
                     c("job", "value"))
The isco_soc_crosswalk() function can translate the
values to the desired taxonomy. The parameter brkd_cols
accepts a vector that indicates other columns used for grouping.
Also, since this is a composite score we set
indicator = TRUE to use mean value. Instead,
if raw counts are given then we set indicator = FALSE to
aggregate the units of the hierarchy.
soc_foundation_skills <- isco_soc_crosswalk(foundation_skills,
brkd_cols = "Skill",
isco_lvl = 1,
soc_lvl = "soc_1",
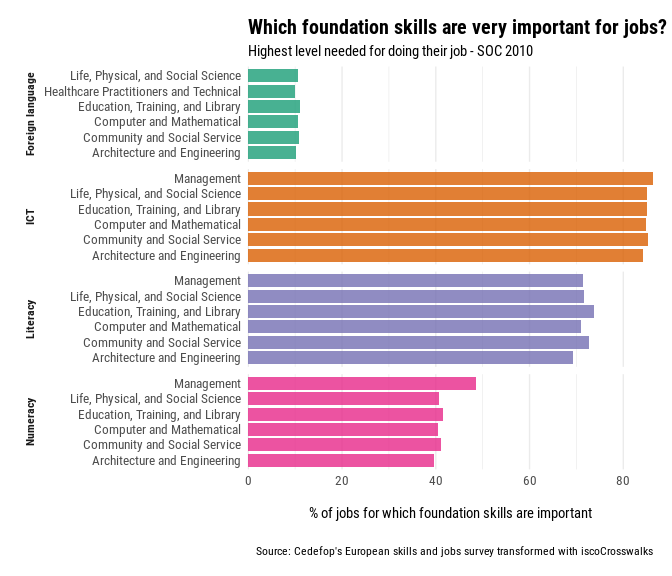
indicator = TRUE)In the following we visualize the top 6 occupations by Skill, of the projected indicator to the SOC taxonomy.
If the reverse process is required, use the
soc_isco_crosswalk() function. The preffered labels of the
taxonomy can be inspected in the included dataset
soc_groups.