The goal of ggtranslate is to provide a simple and
efficient way to translate all user-facing text elements within a
ggplot2 plot. This is particularly useful for creating
multilingual visualizations without manually editing each plot
component.
You can install the released version of ggtranslate from
CRAN with:
install.pacakages('ggtranslate')And the development version from GitHub with:
install.packages("devtools")
devtools::install_github("mathiasleroy/ggtranslate")The core functionality is provided by the ggtranslate()
function. You supply a ggplot object and a named list (your
dictionary) where names are the original text strings found in the plot,
and values are their corresponding translations.
library(ggplot2)
library(ggtranslate)
# Sample data
df <- data.frame(
day = c("Monday", "Tuesday", "Wednesday", "Friday", "Wednesday", "Thursday"),
value = c(10, 12, 8, 11, 9, 12),
region = c("East", "East", "East", "West", "West", "West")
)
# Create a plot with English labels
p_en <- ggplot(df, aes( y = value, x = day )) +
geom_col(aes(
fill = day,
)) +
labs(
title = "Weekly Report",
subtitle = "Sales data for the week",
x = "Day of the Week",
y = "Sales (in millions)",
caption = "Source: Internal data",
fill = "Day of the Week"
) +
geom_text(aes(label = day), vjust = -0.5) +
geom_label(label = "Sales dip on\nWednesdays!", x = "Wednesday", y = 10, vjust = .5) +
facet_wrap(~region, scales = "free_x")
p_en
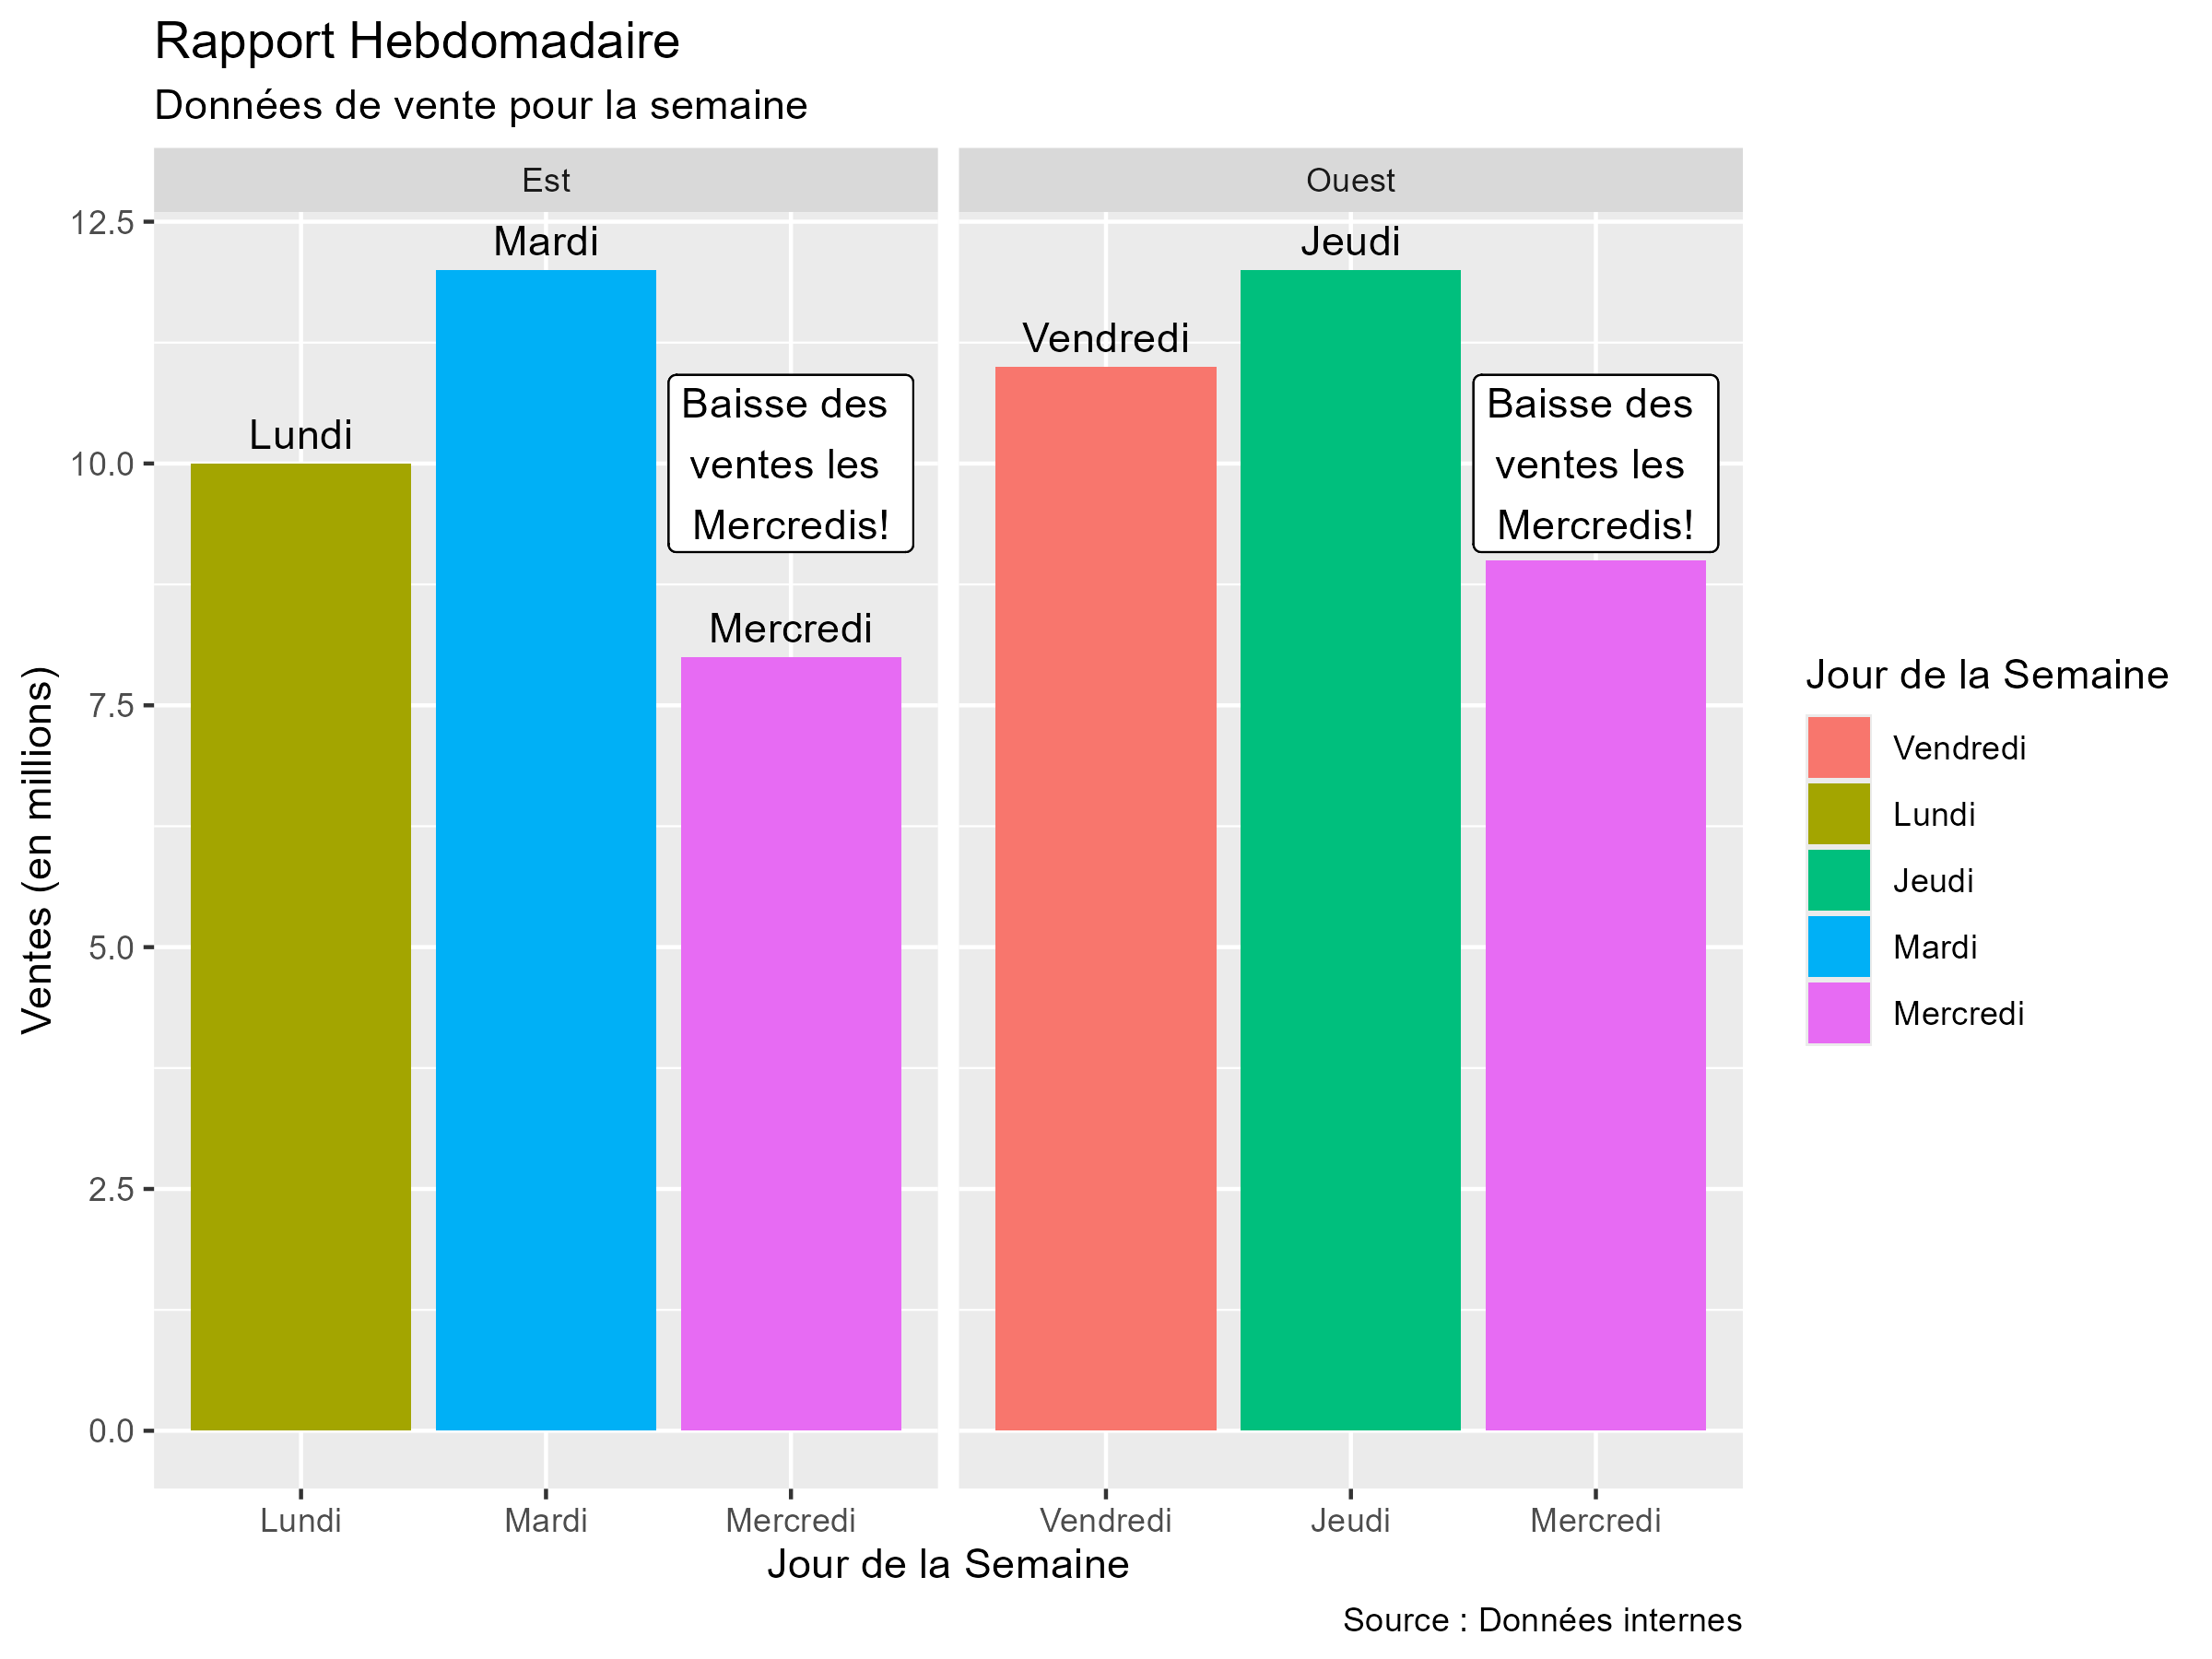
# Define the translation dictionary
dico_fr <- list(
"Weekly Report" = "Rapport Hebdomadaire",
"Sales data for the week" = "Données de vente pour la semaine",
"Day of the Week" = "Jour de la Semaine",
"Sales (in millions)" = "Ventes (en millions)",
"Source: Internal data" = "Source : Données internes",
"Monday" = "Lundi",
"Tuesday" = "Mardi",
"Wednesday" = "Mercredi",
"Thursday" = "Jeudi",
"Friday" = "Vendredi",
"East" = "Est",
"West" = "Ouest",
"Sales dip on\nWednesdays!" = "Baisse des \nventes les \nMercredis!"
)
# Translate the plot
p_fr <- p_en |> ggtranslate(dico_fr)
p_frResult: