![]()
ggreveal is an R package that makes it easy to present
data on ggplot2 graphs incrementally. The functions in this package take
a plot and break it down into a series of intermediary plots that can be
shown in sequence (e.g. in different slides). Like this:
Why would you want to do that? Because it’s fun and very useful for teaching and giving talks.
install.packages("ggreveal")Create a graph with ggplot2 as usual.
library(palmerpenguins)
library(ggplot2)
library(ggreveal)

p <-  ggplot(penguins[!is.na(penguins$sex),],
             aes(body_mass_g, bill_length_mm,
                 group=sex, color=sex)) +
      geom_point() +
      geom_smooth(method="lm", formula = 'y ~ x', linewidth=1) +
      facet_wrap(~species) +
      theme_minimal()
p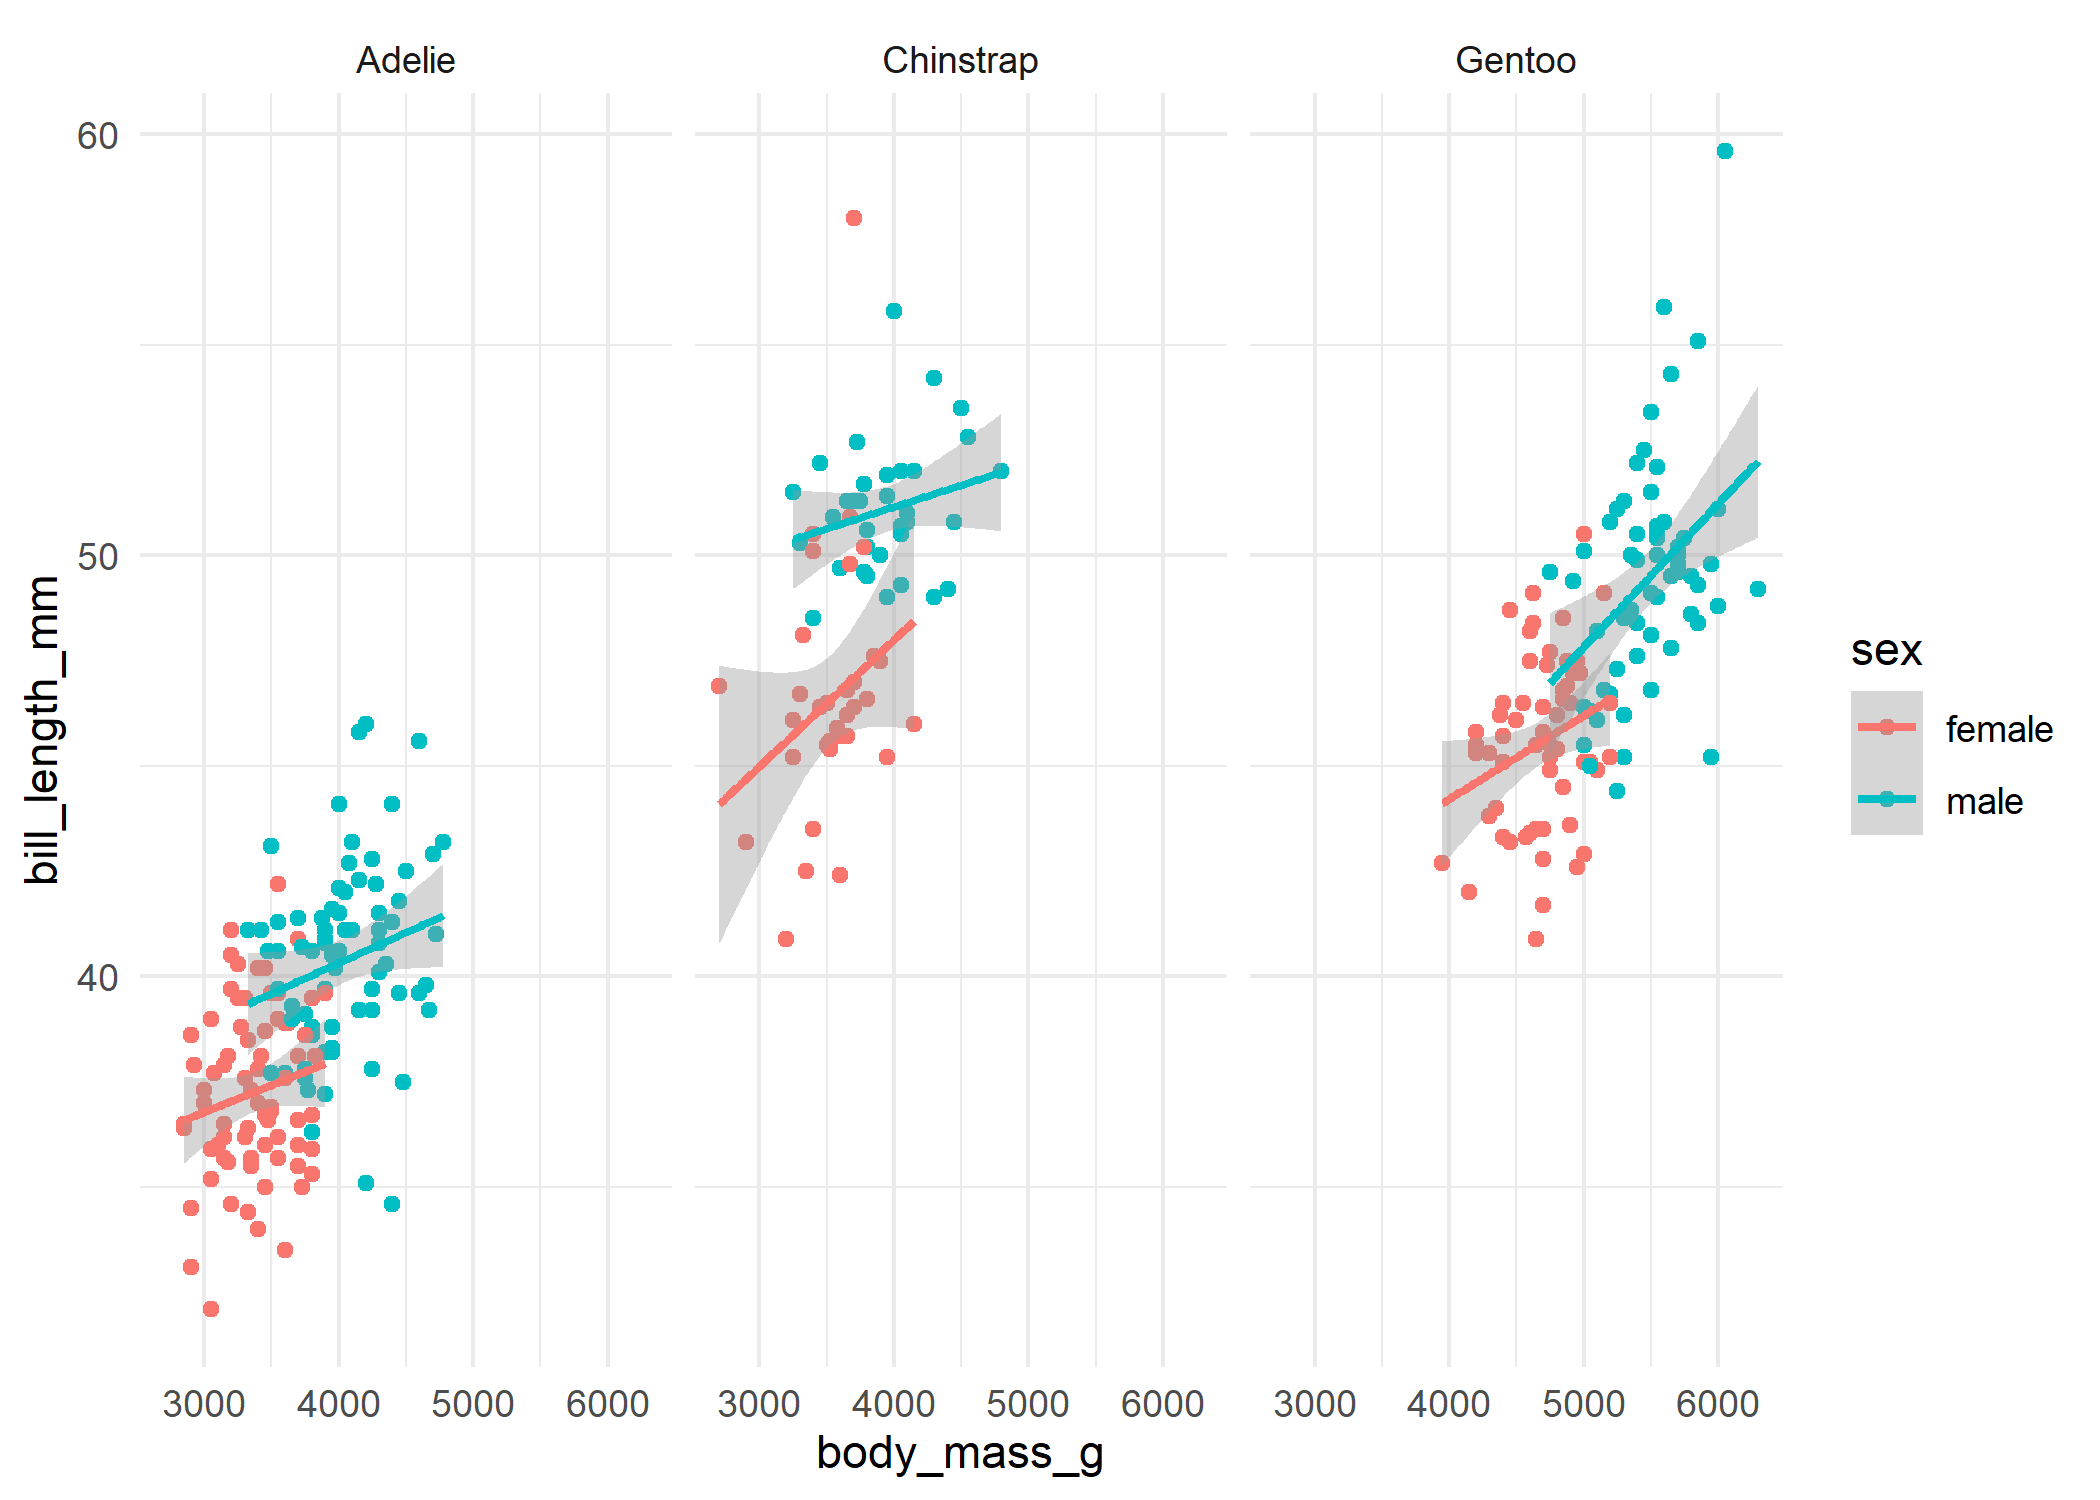
Then use one of the reveal_* functions
(reveal_layers(), reveal_aes(),
reveal_groups(), reveal_panels(),
reveal_x()) to obtain a list of plots that show elements
incrementally.
plot_list <- reveal_groups(p)
plot_list
#> [[1]]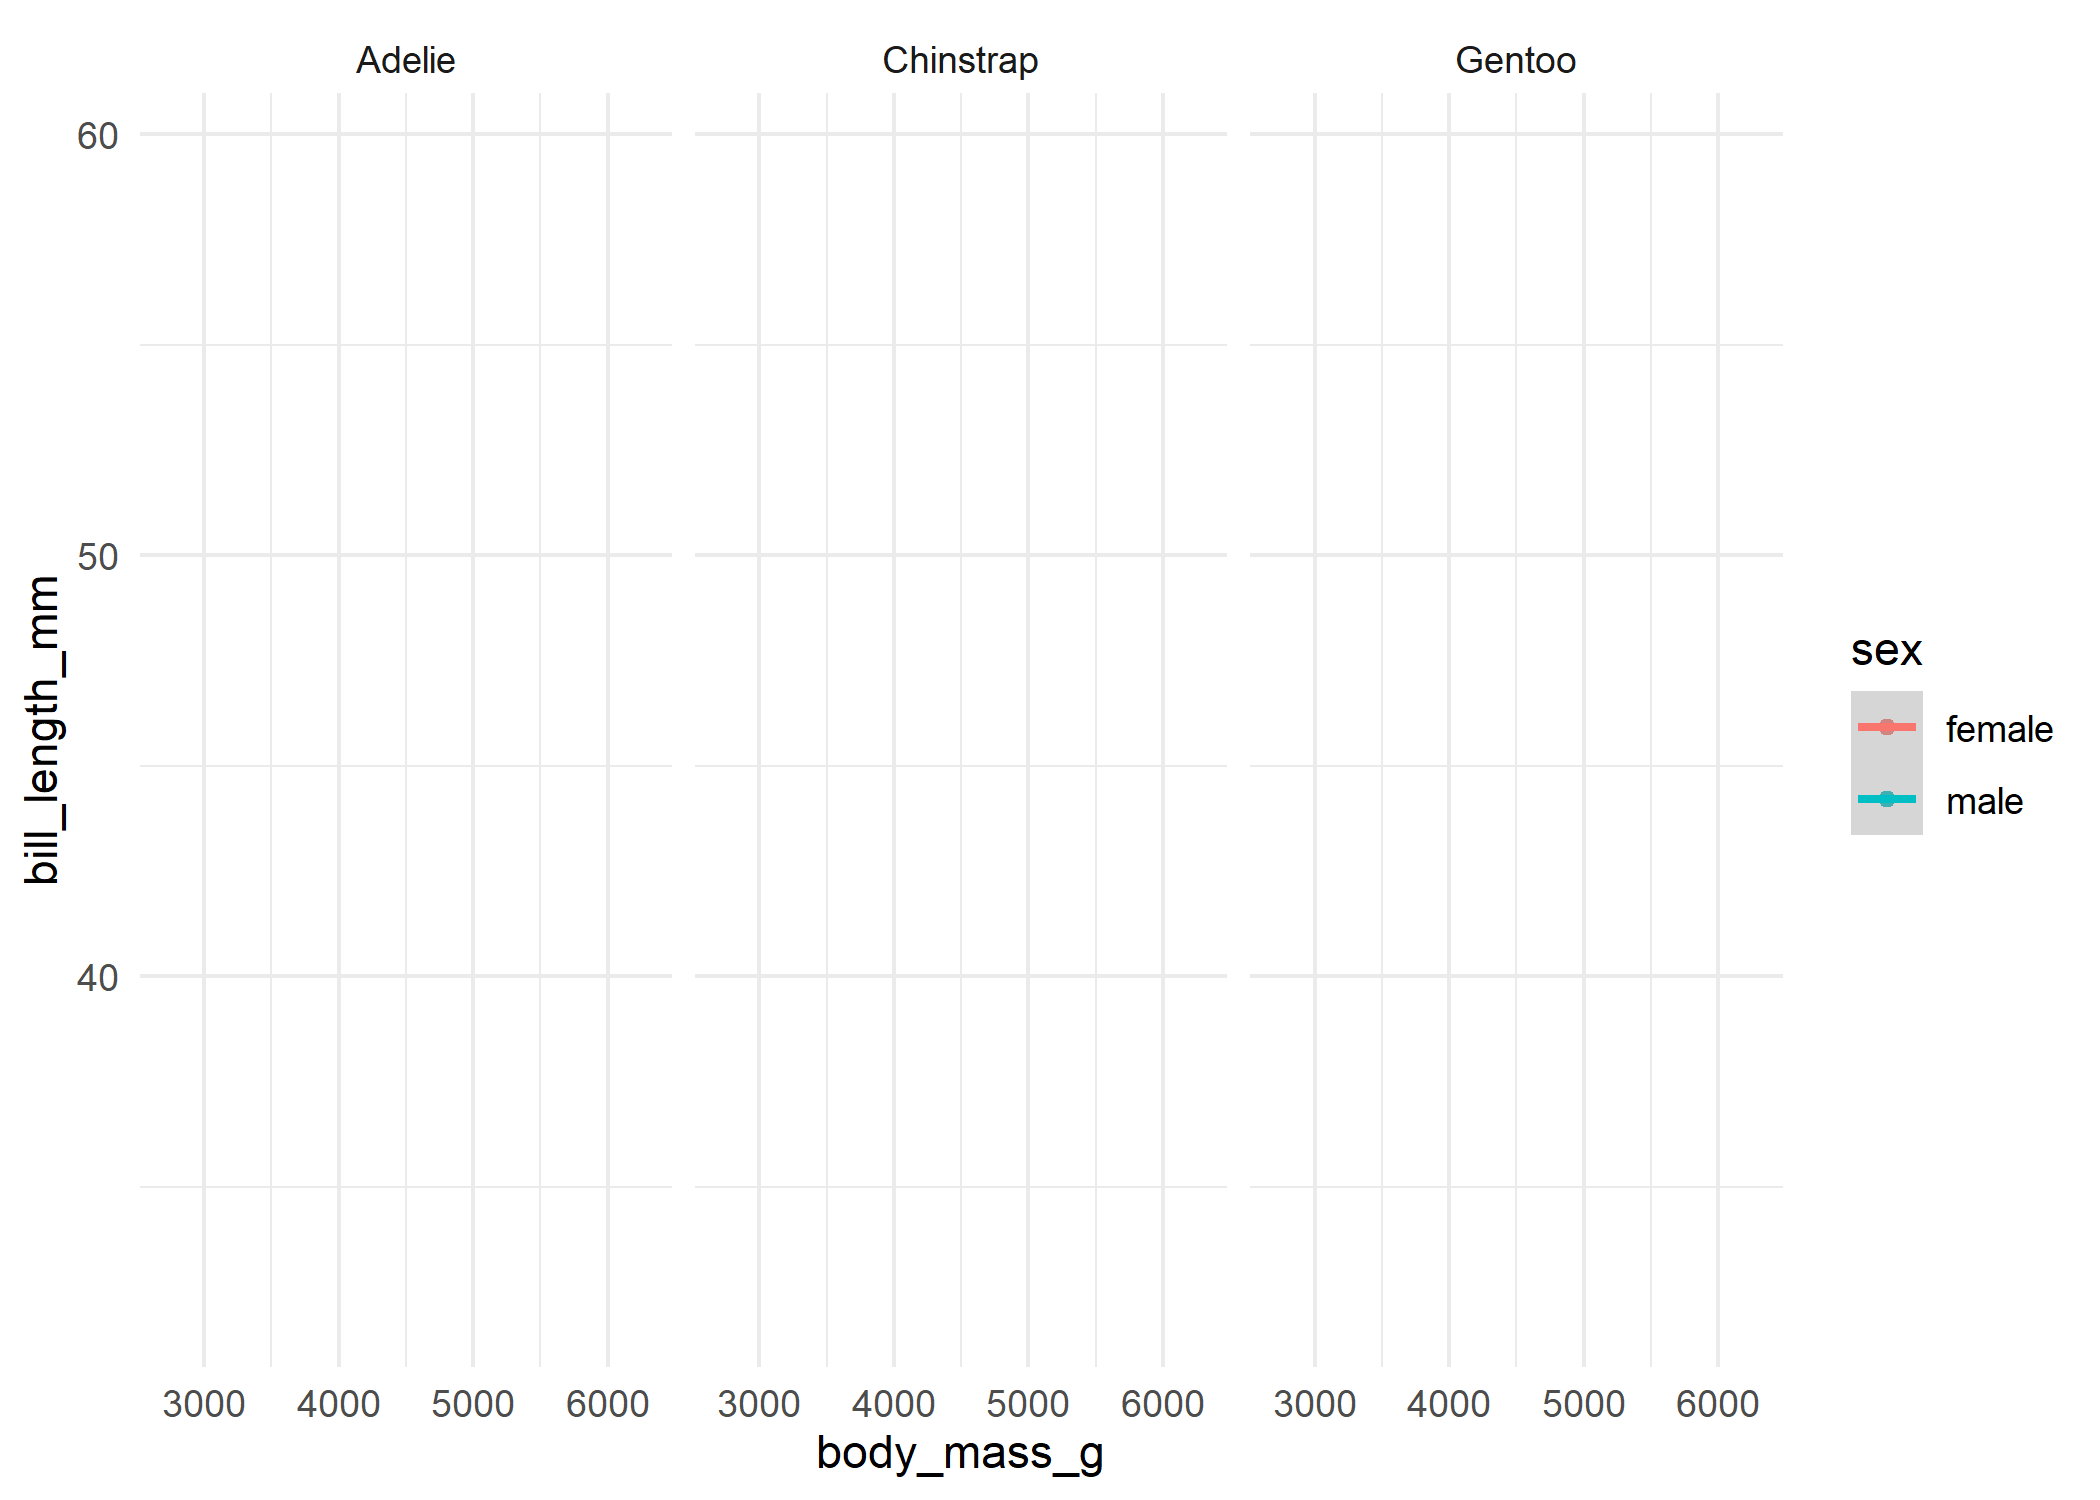
#>
#> [[2]]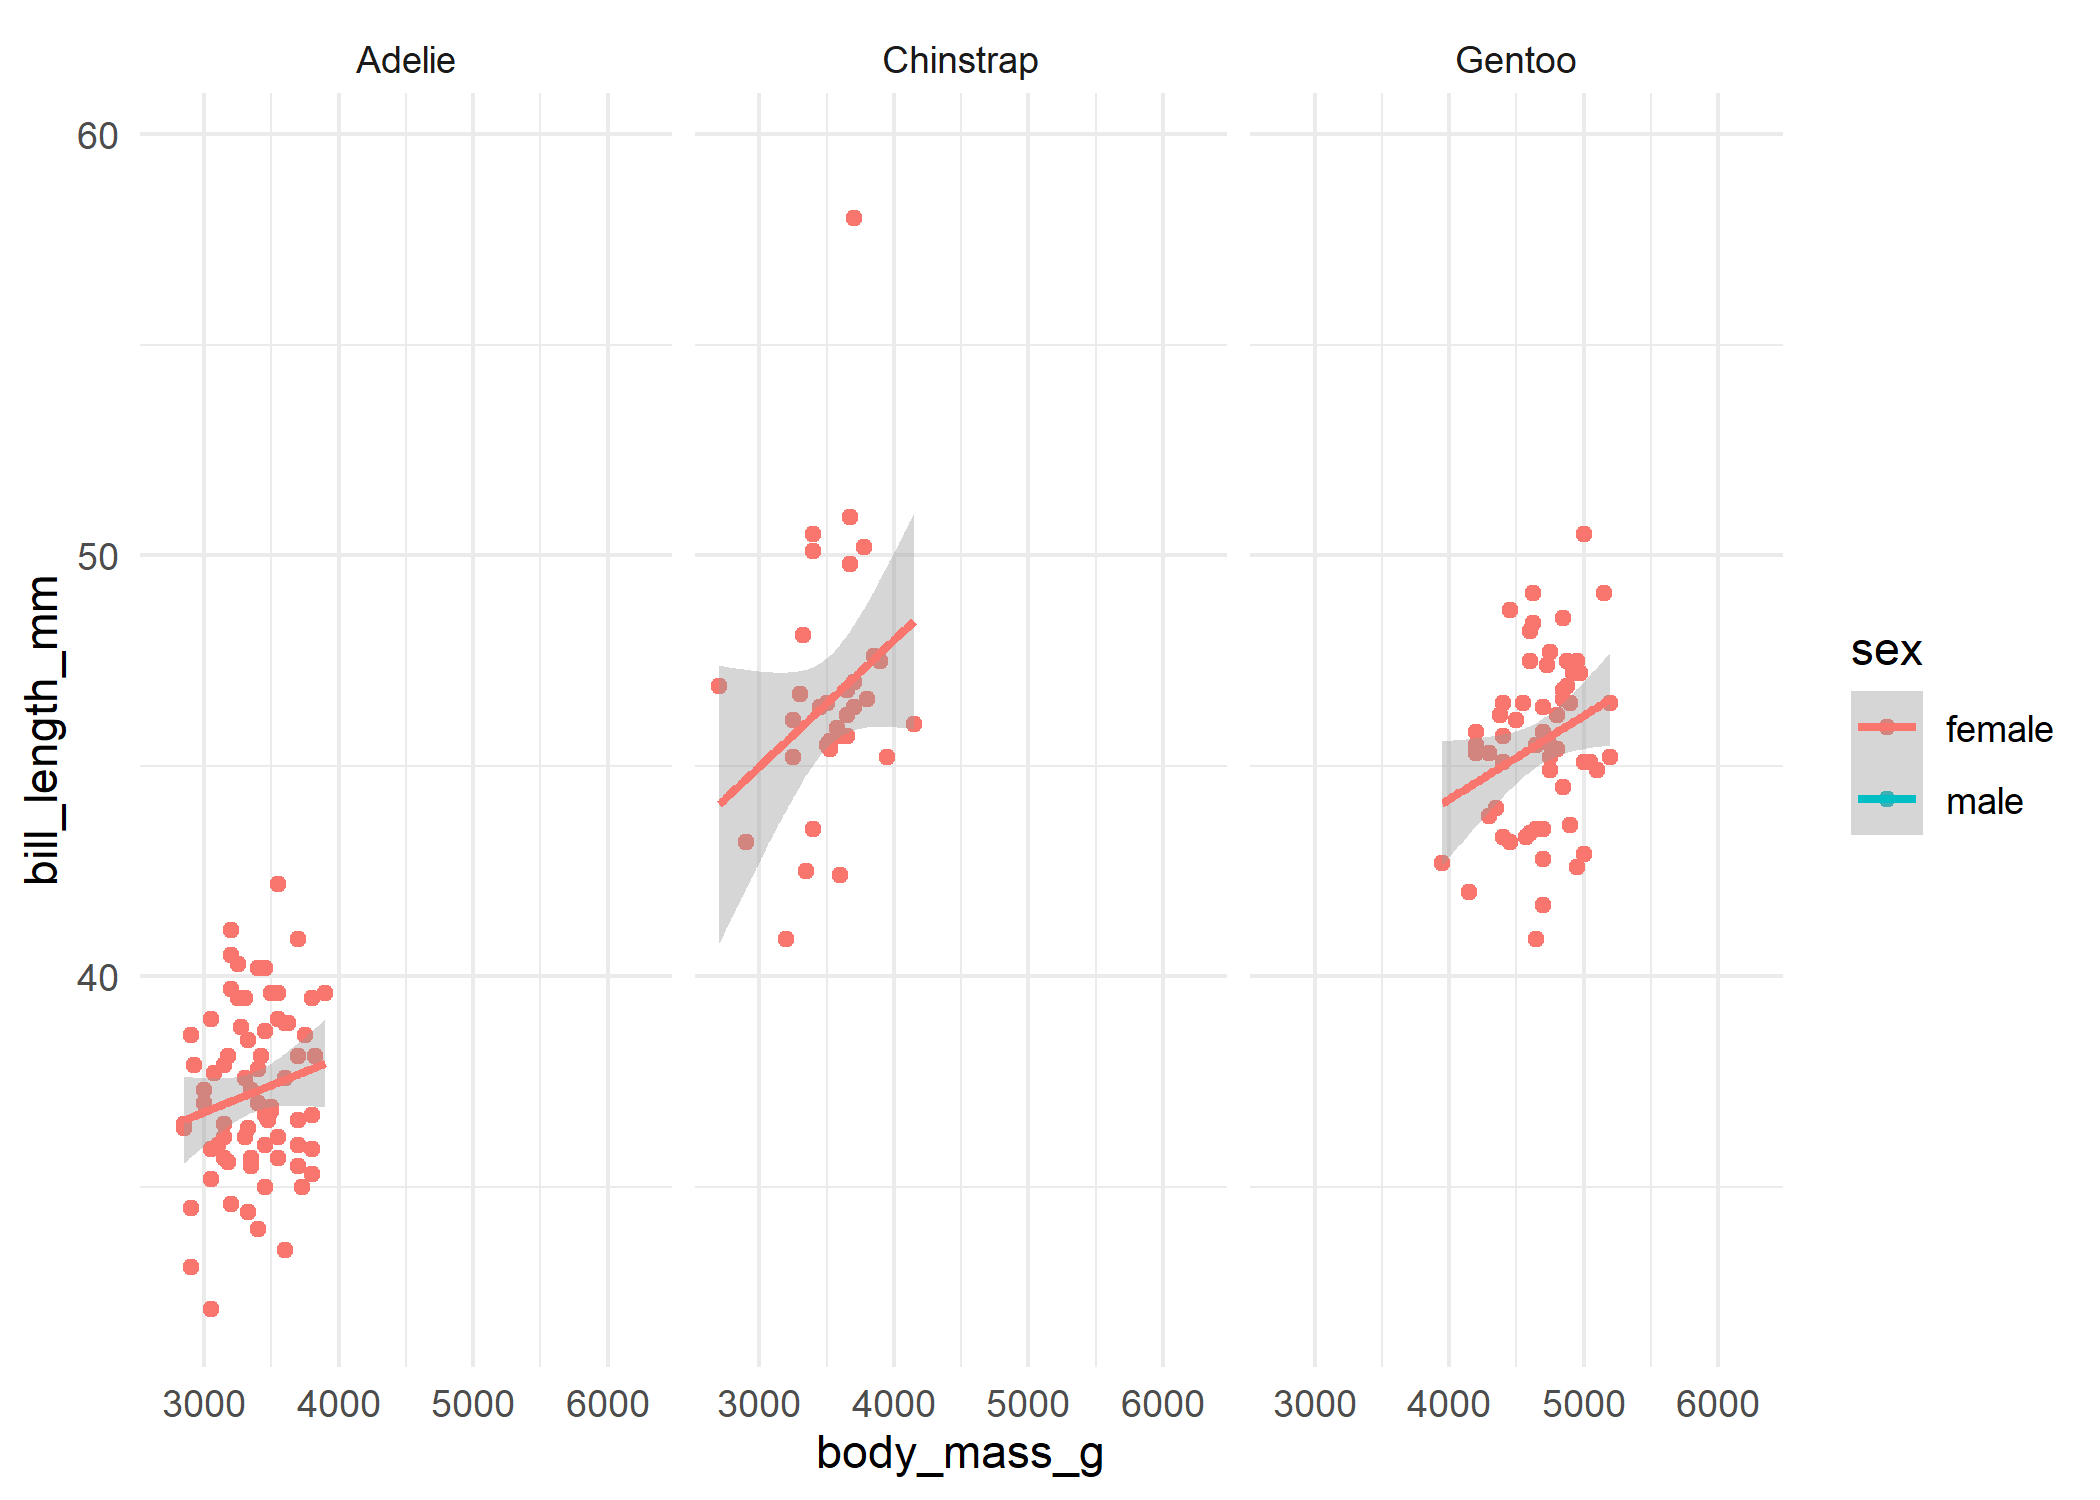
#>
#> [[3]]
You can also use reveal_patchwork() to incrementally
reveal the individual plots in a patchwork object.
The most common use case is to show the plots in different slides of
a presentation. You can work directly with the list of plots returned by
the functions (useful for Quarto and R Markdown presentations), or save
the plots as separate files and include them in your presentation
software of choice. reveal_save() is a convenient function
to save the plots in a list:
reveal_save(plot_list, "myplot.png", width = 8, height = 4)── Saving incremental plots ──
✔ myplot_0.png
✔ myplot_1.png
✔ myplot_2_last.pngYes and no. ggplot2 is composable by design, so it is
straightforward to do some incremental reveal out of the box. For
example, you can create the plot in steps and save the steps
separately:
data("mtcars")
p1 <- ggplot(mtcars,
            aes(mpg, wt)) +
     geom_point()

p2 <- p1 + geom_smooth(method="lm", formula="y~x")
The problem is that, as you add layers and other elements, several
visual aspects of the plot — e.g. range of axes, legends — can, and will
often, change. Showing how the layout changes as you add elements is
useful for teaching how to make graphs in ggplot2, but it is
distracting when you want to focus on the results. Keeping the
layout fixed is sometimes easy (e.g. setting the limits
argument for the x/y scale), but in many cases it requires tinkering
with the internals of the ggplot object.