| Type: | Package |
| Title: | Functions for Tabular Reporting |
| Version: | 0.10.0 |
| Description: | Use a grammar for creating and customizing pretty tables. The following formats are supported: 'HTML', 'PDF', 'Typst', 'RTF', 'Microsoft Word', 'Microsoft PowerPoint', R 'Grid Graphics' and 'patchwork'. 'R Markdown', 'Quarto' and the package 'officer' can be used to produce the result files. The syntax is the same for the user regardless of the type of output to be produced. A set of functions allows the creation, definition of cell arrangement, addition of headers or footers, formatting and definition of cell content with text and or images. The package also offers a set of high-level functions that allow tabular reporting of statistical models and the creation of complex cross tabulations. |
| License: | GPL-3 |
| URL: | https://ardata-fr.github.io/flextable-book/, https://davidgohel.github.io/flextable/ |
| BugReports: | https://github.com/davidgohel/flextable/issues |
| Imports: | data.table (≥ 1.13.0), gdtools (≥ 0.5.0), graphics, grDevices, grid, htmltools, knitr, officer (≥ 0.7.5), ragg, rlang, rmarkdown (≥ 2.0), stats, utils, uuid (≥ 0.1-4), xml2 |
| Suggests: | bookdown (≥ 0.40), broom, broom.mixed, chromote, cluster, commonmark, doconv (≥ 0.3.0), equatags, formatters, ggplot2, gtable, jsonlite, lme4, magick, mgcv, nlme, officedown, patchwork, pdftools, pkgdown (≥ 2.0.0), rtables, scales, svglite, tables (≥ 0.9.17), testthat (≥ 3.0.0), webshot2, withr, xtable |
| VignetteBuilder: | knitr |
| Config/roxygen2/version: | 8.0.0 |
| Config/testthat/edition: | 3 |
| Encoding: | UTF-8 |
| NeedsCompilation: | no |
| Packaged: | 2026-07-07 08:49:11 UTC; davidgohel |
| Author: | David Gohel [aut, cre],
ArData [cph],
Clementine Jager [ctb],
Eli Daniels [ctb],
Panagiotis Skintzos [aut],
Quentin Fazilleau [ctb],
Maxim Nazarov [ctb],
Titouan Robert [ctb],
Michael Barrowman [ctb],
Atsushi Yasumoto [ctb],
Paul Julian [ctb],
Sean Browning [ctb],
Rémi Thériault  [ctb],
Samuel Jobert [ctb],
Keith Newman [ctb]
[ctb],
Samuel Jobert [ctb],
Keith Newman [ctb] |
| Maintainer: | David Gohel <david.gohel@ardata.fr> |
| Repository: | CRAN |
| Date/Publication: | 2026-07-07 11:00:02 UTC |
flextable: Functions for Tabular Reporting
Description
The flextable package facilitates access to and manipulation of tabular reporting elements from R.
The documentation of functions can be opened with command help(package = "flextable").
flextable() function is producing flexible tables where each cell
can contain several chunks of text with their own set of formatting
properties (bold, font color, etc.). Function mk_par() lets customise
text of cells.
Each cell holds a single paragraph composed of inline chunks
(see as_paragraph()). This means cell content is strictly
inline: bold, italic, links, images, equations, inline code, etc.
Block-level structures (multiple paragraphs, bullet lists,
headings or fenced code blocks) cannot be placed inside a cell.
Soft line breaks (\n) are however supported.
The as_flextable() function is used to transform specific objects into
flextable objects. For example, you can transform a crosstab produced with
the 'tables' package into a flextable which can then be formatted,
annotated or augmented with footnotes.
In order to reduce the homogenization efforts and the number of functions
to be called, it is recommended to define formatting properties such as
font, border color, number of decimals displayed which will then be applied
by default. See set_flextable_defaults() for more details.
Table Structure
A flextable is composed of three distinct parts:
-
header: By default, contains one row with the column names from the data.frame -
body: Contains the actual data from the data.frame -
footer: Empty by default, but can contain content (commonly used for footnotes or #' summary rows)
       HEADER         <- Column names, labels, spanning headers
--------------------
        BODY          <- Data rows
--------------------
       FOOTER         <- Summary rows, notes, footnotes (optional)
A basic flextable has:
in the part 'header': 1 row with column names
in the part 'body': as many rows as there are in the input data.frame
no footer
Rows and columns can be added or removed to the basic flextable:
Add new rows in header with
add_header(),add_header_row(),add_header_lines()andset_header_labels().Add new rows in footer with
add_footer(),add_footer_lines(),set_header_footer_df()andadd_footer_row().Add new rows in body with
add_body()andadd_body_row().Delete columns with
delete_columns().Delete a part with
delete_part().Use column names to separate a simple header row into multiple nested rows with
separate_header().
Selectors in flextable
Selectors are a core feature of flextable that allow you to specify which
parts (part), rows (i) and columns (j) should be affected by formatting,
styling, or content operations. See the corresponding manual:
<Selectors in flextable>.
Author(s)
Maintainer: David Gohel david.gohel@ardata.fr
Authors:
David Gohel david.gohel@ardata.fr
Panagiotis Skintzos panagiotis.skintzos@ardata.fr
Other contributors:
ArData [copyright holder]
Clementine Jager [contributor]
Eli Daniels [contributor]
Quentin Fazilleau [contributor]
Maxim Nazarov [contributor]
Titouan Robert [contributor]
Michael Barrowman [contributor]
Atsushi Yasumoto [contributor]
Paul Julian [contributor]
Sean Browning [contributor]
Rémi Thériault (ORCID) [contributor]
Samuel Jobert [contributor]
Keith Newman [contributor]
See Also
https://davidgohel.github.io/flextable/,
https://ardata-fr.github.io/flextable-book/, flextable()
Add body rows with one value per column
Description
Add new rows to the body where each value maps to a named column,
preserving the original column data types.
Unlike add_body_row() where labels can span multiple columns,
here each value fills exactly one column.
If some columns are not provided, they will be replaced by
NA and displayed as empty.
Usage
add_body(x, top = TRUE, ..., values = NULL)
Arguments
x |
a 'flextable' object, see flextable-package to learn how to create 'flextable' object. |
top |
should the rows be inserted at the top or the bottom. |
... |
named arguments (names are data colnames) of values
to add. It is important to insert data of the same type as the
original data, otherwise it will be transformed (probably
into strings if you add a |
values |
a list of name-value pairs of labels or values,
names should be existing col_key values. This argument can be used
instead of |
See Also
Other row and column operations:
add_body_row(),
add_footer(),
add_footer_lines(),
add_footer_row(),
add_header(),
add_header_lines(),
add_header_row(),
delete_columns(),
delete_part(),
delete_rows(),
paginate(),
separate_header(),
set_header_footer_df,
set_header_labels(),
split_columns(),
split_rows(),
split_to_pages()
Examples
ft <- flextable(head(iris),
  col_keys = c(
    "Species", "Sepal.Length", "Petal.Length",
    "Sepal.Width", "Petal.Width"
  )
)

ft <- add_body(
  x = ft, Sepal.Length = 1:5,
  Sepal.Width = 1:5 * 2, Petal.Length = 1:5 * 3,
  Petal.Width = 1:5 + 10, Species = "Blah", top = FALSE
)

ft <- theme_booktabs(ft)
ft
Add a body row with spanning labels
Description
Add a single row to the body where labels can span
multiple columns (merged cells) via the colwidths argument.
Labels are associated with a number of columns to merge that default to one if not specified. In this case, you have to make sure that the number of labels is equal to the number of columns displayed.
The function can add only one single row by call.
Labels can also be formatted with as_paragraph().
Usage
add_body_row(x, top = TRUE, values = list(), colwidths = integer(0))
Arguments
x |
a 'flextable' object, see flextable-package to learn how to create 'flextable' object. |
top |
should the row be inserted at the top or the bottom. |
values |
values to add. It can be a If it is a list, it can be a named list with the names of the columns of the
original data.frame or the |
colwidths |
the number of columns to merge in the row for each label |
See Also
Other row and column operations:
add_body(),
add_footer(),
add_footer_lines(),
add_footer_row(),
add_header(),
add_header_lines(),
add_header_row(),
delete_columns(),
delete_part(),
delete_rows(),
paginate(),
separate_header(),
set_header_footer_df,
set_header_labels(),
split_columns(),
split_rows(),
split_to_pages()
Examples
library(flextable)

ft01 <- fp_text_default(color = "red")
ft02 <- fp_text_default(color = "orange")

pars <- as_paragraph(
  as_chunk(c("(1)", "(2)"), props = ft02), " ",
  as_chunk(
    c(
      "My tailor is rich",
      "My baker is rich"
    ),
    props = ft01
  )
)

ft_1 <- flextable(head(mtcars))
ft_1 <- add_body_row(ft_1,
  values = pars,
  colwidths = c(5, 6), top = FALSE
)
ft_1 <- add_body_row(ft_1,
  values = pars,
  colwidths = c(3, 8), top = TRUE
)
ft_1 <- theme_box(ft_1)
ft_1

ft_2 <- flextable(head(airquality))
ft_2 <- add_body_row(ft_2,
  values = c("blah", "bleeeh"),
  colwidths = c(4, 2), top = TRUE
)
ft_2 <- theme_box(ft_2)
ft_2
Add footer rows with one value per column
Description
Add new rows to the footer where each value maps to a named column.
Unlike add_footer_row() where labels can span multiple columns,
here each value fills exactly one column.
If some columns are not provided, they will be replaced by
NA and displayed as empty.
Usage
add_footer(x, top = TRUE, ..., values = NULL)
Arguments
x |
a 'flextable' object, see flextable-package to learn how to create 'flextable' object. |
top |
should the rows be inserted at the top or the bottom. |
... |
named arguments (names are data colnames) of values
to add. It is important to insert data of the same type as the
original data, otherwise it will be transformed (probably
into strings if you add a |
values |
a list of name-value pairs of labels or values,
names should be existing col_key values. This argument can be used
instead of |
See Also
Other row and column operations:
add_body(),
add_body_row(),
add_footer_lines(),
add_footer_row(),
add_header(),
add_header_lines(),
add_header_row(),
delete_columns(),
delete_part(),
delete_rows(),
paginate(),
separate_header(),
set_header_footer_df,
set_header_labels(),
split_columns(),
split_rows(),
split_to_pages()
Examples
new_row <- as.list(colMeans(iris[, -5]))
new_row$Species <- "Means"

formatter <- function(x) sprintf("%.1f", x)

ft <- flextable(data = head(iris))
ft <- add_footer(ft, values = new_row)

# cosmetics
ft <- compose(
  x = ft, j = 1:4,
  value = as_paragraph(
    as_chunk(., formatter = formatter)
  ),
  part = "footer", use_dot = TRUE
)
ft <- align(ft, part = "footer", align = "right", j = 1:4)
ft
Add full-width rows to the footer
Description
Add one or more rows to the footer where each label spans all columns (all cells merged into one). Useful for adding footnotes or source notes below the table.
Usage
add_footer_lines(x, values = character(0), top = FALSE)
Arguments
x |
a 'flextable' object, see flextable-package to learn how to create 'flextable' object. |
values |
a character vector or a call to |
top |
should the row be inserted at the top or the bottom. Default to TRUE. |
See Also
Other row and column operations:
add_body(),
add_body_row(),
add_footer(),
add_footer_row(),
add_header(),
add_header_lines(),
add_header_row(),
delete_columns(),
delete_part(),
delete_rows(),
paginate(),
separate_header(),
set_header_footer_df,
set_header_labels(),
split_columns(),
split_rows(),
split_to_pages()
Examples
ft_1 <- flextable(head(iris))
ft_1 <- add_footer_lines(ft_1,
  values = c("blah 1", "blah 2")
)
ft_1
Add a footer row with spanning labels
Description
Add a single row to the footer where labels can span
multiple columns (merged cells) via the colwidths argument.
Labels are associated with a number of columns to merge that default to one if not specified. In this case, you have to make sure that the number of labels is equal to the number of columns displayed.
The function can add only one single row by call.
Labels can be formatted with as_paragraph().
Usage
add_footer_row(x, top = TRUE, values = character(0), colwidths = integer(0))
Arguments
x |
a 'flextable' object, see flextable-package to learn how to create 'flextable' object. |
top |
should the row be inserted at the top or the bottom. |
values |
values to add. It can be a If it is a list, it can be a named list with the names of the columns of the
original data.frame or the |
colwidths |
the number of columns to merge in the row for each label |
See Also
Other row and column operations:
add_body(),
add_body_row(),
add_footer(),
add_footer_lines(),
add_header(),
add_header_lines(),
add_header_row(),
delete_columns(),
delete_part(),
delete_rows(),
paginate(),
separate_header(),
set_header_footer_df,
set_header_labels(),
split_columns(),
split_rows(),
split_to_pages()
Examples
library(flextable)

ft01 <- fp_text_default(color = "red")
ft02 <- fp_text_default(color = "orange")

pars <- as_paragraph(
  as_chunk(c("(1)", "(2)"), props = ft02), " ",
  as_chunk(
    c(
      "My tailor is rich",
      "My baker is rich"
    ),
    props = ft01
  )
)

ft_1 <- flextable(head(mtcars))
ft_1 <- add_footer_row(ft_1,
  values = pars,
  colwidths = c(5, 6), top = FALSE
)
ft_1 <- add_footer_row(ft_1,
  values = pars,
  colwidths = c(3, 8), top = TRUE
)
ft_1

ft_2 <- flextable(head(airquality))
ft_2 <- add_footer_row(ft_2,
  values = c("Measure", "Time"),
  colwidths = c(4, 2), top = TRUE
)
ft_2 <- theme_box(ft_2)
ft_2
Add header rows with one value per column
Description
Add new rows to the header where each value maps to a named column.
Unlike add_header_row() where labels can span multiple columns,
here each value fills exactly one column.
If some columns are not provided, they will be replaced by
NA and displayed as empty.
Usage
add_header(x, top = TRUE, ..., values = NULL)
Arguments
x |
a 'flextable' object, see flextable-package to learn how to create 'flextable' object. |
top |
should the rows be inserted at the top or the bottom. |
... |
named arguments (names are data colnames) of values
to add. It is important to insert data of the same type as the
original data, otherwise it will be transformed (probably
into strings if you add a |
values |
a list of name-value pairs of labels or values,
names should be existing col_key values. This argument can be used
instead of |
Note
when repeating values, they can be merged together with
function merge_h() and merge_v().
See Also
Other row and column operations:
add_body(),
add_body_row(),
add_footer(),
add_footer_lines(),
add_footer_row(),
add_header_lines(),
add_header_row(),
delete_columns(),
delete_part(),
delete_rows(),
paginate(),
separate_header(),
set_header_footer_df,
set_header_labels(),
split_columns(),
split_rows(),
split_to_pages()
Examples
library(flextable)

fun <- function(x) {
  paste0(
    c("min: ", "max: "),
    formatC(range(x))
  )
}
new_row <- list(
  Sepal.Length = fun(iris$Sepal.Length),
  Sepal.Width =  fun(iris$Sepal.Width),
  Petal.Width =  fun(iris$Petal.Width),
  Petal.Length = fun(iris$Petal.Length)
)

ft_1 <- flextable(data = head(iris))
ft_1 <- add_header(ft_1, values = new_row, top = FALSE)
ft_1 <- append_chunks(ft_1, part = "header", i = 2, )
ft_1 <- theme_booktabs(ft_1, bold_header = TRUE)
ft_1 <- align(ft_1, align = "center", part = "all")
ft_1
Add full-width rows to the header
Description
Add one or more rows to the header where each label spans all columns (all cells merged into one). Useful for adding titles or subtitles above the column headers.
Usage
add_header_lines(x, values = character(0), top = TRUE)
Arguments
x |
a 'flextable' object, see flextable-package to learn how to create 'flextable' object. |
values |
a character vector or a call to |
top |
should the row be inserted at the top or the bottom. Default to TRUE. |
See Also
Other row and column operations:
add_body(),
add_body_row(),
add_footer(),
add_footer_lines(),
add_footer_row(),
add_header(),
add_header_row(),
delete_columns(),
delete_part(),
delete_rows(),
paginate(),
separate_header(),
set_header_footer_df,
set_header_labels(),
split_columns(),
split_rows(),
split_to_pages()
Examples
# ex 1----
ft_1 <- flextable(head(iris))
ft_1 <- add_header_lines(ft_1, values = "blah blah")
ft_1 <- add_header_lines(ft_1, values = c("blah 1", "blah 2"))
ft_1 <- autofit(ft_1)
ft_1

# ex 2----
ft01 <- fp_text_default(color = "red")
ft02 <- fp_text_default(color = "orange")
ref <- c("(1)", "(2)")
pars <- as_paragraph(
  as_chunk(ref, props = ft02), " ",
  as_chunk(rep("My tailor is rich", length(ref)), props = ft01)
)

ft_2 <- flextable(head(mtcars))
ft_2 <- add_header_lines(ft_2, values = pars, top = FALSE)
ft_2 <- add_header_lines(ft_2, values = ref, top = TRUE)
ft_2 <- add_footer_lines(ft_2, values = "blah", top = TRUE)
ft_2 <- add_footer_lines(ft_2, values = pars, top = TRUE)
ft_2 <- add_footer_lines(ft_2, values = ref, top = FALSE)
ft_2 <- autofit(ft_2)
ft_2
Add a header row with spanning labels
Description
Add a single row to the header where labels can span
multiple columns (merged cells) via the colwidths argument.
Labels are associated with a number of columns to merge that default to one if not specified. In this case, you have to make sure that the number of labels is equal to the number of columns displayed.
The function can add only one single row by call.
Labels can also be formatted with as_paragraph().
Usage
add_header_row(x, top = TRUE, values = character(0), colwidths = integer(0))
Arguments
x |
a 'flextable' object, see flextable-package to learn how to create 'flextable' object. |
top |
should the row be inserted at the top or the bottom. Default to TRUE. |
values |
values to add, a character vector (as header rows
contains only character values/columns), a list
or a call to |
colwidths |
the number of columns used for each label |
See Also
Other row and column operations:
add_body(),
add_body_row(),
add_footer(),
add_footer_lines(),
add_footer_row(),
add_header(),
add_header_lines(),
delete_columns(),
delete_part(),
delete_rows(),
paginate(),
separate_header(),
set_header_footer_df,
set_header_labels(),
split_columns(),
split_rows(),
split_to_pages()
Examples
library(flextable)

ft01 <- fp_text_default(color = "red")
ft02 <- fp_text_default(color = "orange")

pars <- as_paragraph(
  as_chunk(c("(1)", "(2)"), props = ft02), " ",
  as_chunk(c(
    "My tailor is rich",
    "My baker is rich"
  ), props = ft01)
)

ft_1 <- flextable(head(mtcars))
ft_1 <- add_header_row(ft_1,
  values = pars,
  colwidths = c(5, 6), top = FALSE
)
ft_1 <- add_header_row(ft_1,
  values = pars,
  colwidths = c(3, 8), top = TRUE
)
ft_1

ft_2 <- flextable(head(airquality))
ft_2 <- add_header_row(ft_2,
  values = c("Measure", "Time"),
  colwidths = c(4, 2), top = TRUE
)
ft_2 <- theme_box(ft_2)
ft_2
Add latex dependencies
Description
Manually add flextable latex dependencies to
the knitr session via knitr::knit_meta_add().
When enabling caching in 'R Markdown' documents for PDF output,
the flextable cached result is used directly. Call add_latex_dep() in a
non cached chunk so that flextable latex dependencies are added
to knitr metadata.
Usage
add_latex_dep(float = FALSE, wrapfig = FALSE)
Arguments
float |
load package 'float' |
wrapfig |
load package 'wrapfig' |
See Also
Other flextable configuration:
use_df_printer(),
use_flextable_qmd(),
use_model_printer()
Examples
add_latex_dep()
Set text alignment
Description
Change the text alignment of selected rows and columns of a flextable.
Usage
align(
  x,
  i = NULL,
  j = NULL,
  align = "left",
  part = c("body", "header", "footer", "all")
)

align_text_col(x, align = "left", header = TRUE, footer = TRUE)

align_nottext_col(x, align = "right", header = TRUE, footer = TRUE)
Arguments
x |
a 'flextable' object, see flextable-package to learn how to create 'flextable' object. |
i |
row selector, see section Row selection with the |
j |
column selector, see section Column selection with the |
align |
text alignment - a single character value, or a vector of
character values equal in length to the number of columns selected by If the number of columns is a multiple of the length of the |
part |
part selector, see section Part selection with the |
header |
should the header be aligned with the body |
footer |
should the footer be aligned with the body |
See Also
Other formatting shortcuts:
bg(),
bold(),
color(),
empty_blanks(),
font(),
fontsize(),
highlight(),
indentation(),
italic(),
keep_with_next(),
line_spacing(),
padding(),
rotate(),
style(),
tab_settings(),
valign()
Examples
# Table of 6 columns
ft_car <- flextable(head(mtcars)[, 2:7])

# All 6 columns right aligned
align(ft_car, align = "right", part = "all")

# Manually specify alignment of each column
align(
  ft_car,
  align = c("left", "right", "left", "center", "center", "right"),
  part = "all"
)

# Center-align column 2 and left-align column 5
align(ft_car, j = c(2, 5), align = c("center", "left"), part = "all")

# Alternate left and center alignment across columns 1-4 for header only
align(ft_car, j = 1:4, align = c("left", "center"), part = "header")
ftab <- flextable(mtcars)
ftab <- align_text_col(ftab, align = "left")
ftab <- align_nottext_col(ftab, align = "right")
ftab
Append chunks to flextable content
Description
append chunks (for example chunk as_chunk())
in a flextable.
Usage
append_chunks(x, ..., i = NULL, j = NULL, part = "body")
Arguments
x |
a 'flextable' object, see flextable-package to learn how to create 'flextable' object. |
... |
chunks to be appened, see |
i |
row selector, see section Row selection with the |
j |
column selector, see section Column selection with the |
part |
part selector, see section Part selection with the |
See Also
as_chunk(), as_sup(), as_sub(), colorize()
Other functions to compose cell content:
as_paragraph(),
compose(),
footnote(),
labelizor(),
prepend_chunks(),
void()
Examples
library(flextable)
img.file <- file.path(R.home("doc"), "html", "logo.jpg")

ft_1 <- flextable(head(cars))

ft_1 <- append_chunks(ft_1,
  # where to append
  i = c(1, 3, 5),
  j = 1,
  # what to append
  as_chunk(" "),
  as_image(src = img.file, width = .20, height = .15)
)
ft_1 <- set_table_properties(ft_1, layout = "autofit")
ft_1
internal utils for roxygen tags reuse
Description
internal utils for roxygen tags reuse
Arguments
x |
a 'flextable' object, see flextable-package to learn how to create 'flextable' object. |
i |
row selector, see section Row selection with the |
j |
column selector, see section Column selection with the |
part |
part selector, see section Part selection with the |
internal utils for roxygen tags reuse
Description
internal utils for roxygen tags reuse
Arguments
x |
a 'flextable' object, see flextable-package to learn how to create 'flextable' object. |
i |
row selector, see section Row selection with the |
j |
column selector, see section Column selection with the |
internal utils for roxygen tags reuse
Description
internal utils for roxygen tags reuse
Arguments
x |
a 'flextable' object, see flextable-package to learn how to create 'flextable' object. |
i |
row selector, see section Row selection with the |
part |
part selector, see section Part selection with the |
internal utils for roxygen tags reuse
Description
internal utils for roxygen tags reuse
Arguments
x |
a 'flextable' object, see flextable-package to learn how to create 'flextable' object. |
i |
row selector, see section Row selection with the |
part |
part selector, see section Part selection with the |
internal utils for roxygen tags reuse
Description
internal utils for roxygen tags reuse
Arguments
x |
a 'flextable' object, see flextable-package to learn how to create 'flextable' object. |
j |
column selector, see section Column selection with the |
internal utils for roxygen tags reuse
Description
internal utils for roxygen tags reuse
Arguments
x |
a 'flextable' object, see flextable-package to learn how to create 'flextable' object. |
j |
column selector, see section Column selection with the |
part |
part selector, see section Part selection with the |
internal utils for roxygen tags reuse
Description
internal utils for roxygen tags reuse
Arguments
x |
a 'flextable' object, see flextable-package to learn how to create 'flextable' object. |
j |
column selector, see section Column selection with the |
part |
part selector, see section Part selection with the |
internal utils for roxygen tags reuse
Description
internal utils for roxygen tags reuse
Arguments
x |
a 'flextable' object, see flextable-package to learn how to create 'flextable' object. |
internal utils for roxygen tags reuse
Description
internal utils for roxygen tags reuse
Arguments
x |
a 'flextable' object, see flextable-package to learn how to create 'flextable' object. |
part |
part selector, see section Part selection with the |
internal utils for roxygen tags reuse
Description
internal utils for roxygen tags reuse
Arguments
x |
a 'flextable' object, see flextable-package to learn how to create 'flextable' object. |
part |
part selector, see section Part selection with the |
Bold chunk
Description
The function is producing a chunk with bold font.
It is used to add it to the content of a cell of the
flextable with the functions compose(), append_chunks()
or prepend_chunks().
Usage
as_b(x)
Arguments
x |
value, if a chunk, the chunk will be updated |
See Also
Other chunk elements for paragraph:
as_bracket(),
as_chunk(),
as_equation(),
as_highlight(),
as_i(),
as_image(),
as_qmd(),
as_strike(),
as_sub(),
as_sup(),
as_word_field(),
colorize(),
gg_chunk(),
grid_chunk(),
hyperlink_text(),
linerange(),
minibar(),
plot_chunk()
Examples
ft <- flextable(head(iris),
  col_keys = c("Sepal.Length", "dummy")
)

ft <- compose(ft,
  j = "dummy",
  value = as_paragraph(
    as_b(Sepal.Length)
  )
)

ft
Bracket chunk
Description
The function is producing a chunk by pasting values and add the result in brackets.
It is used to add it to the content of a cell of the
flextable with the functions compose(), append_chunks()
or prepend_chunks().
Usage
as_bracket(..., sep = ", ", p = "(", s = ")")
Arguments
... |
text and column names |
sep |
separator |
p |
prefix, default to '(' |
s |
suffix, default to ')' |
See Also
Other chunk elements for paragraph:
as_b(),
as_chunk(),
as_equation(),
as_highlight(),
as_i(),
as_image(),
as_qmd(),
as_strike(),
as_sub(),
as_sup(),
as_word_field(),
colorize(),
gg_chunk(),
grid_chunk(),
hyperlink_text(),
linerange(),
minibar(),
plot_chunk()
Examples
ft <- flextable(head(iris),
  col_keys = c("Species", "Sepal", "Petal")
)
ft <- set_header_labels(ft, Sepal = "Sepal", Petal = "Petal")
ft <- compose(ft,
  j = "Sepal",
  value = as_paragraph(as_bracket(Sepal.Length, Sepal.Width))
)
ft <- compose(ft,
  j = "Petal",
  value = as_paragraph(as_bracket(Petal.Length, Petal.Width))
)
ft
Text chunk
Description
The function lets add formated text in flextable cells.
It is used to add it to the content of a cell of the
flextable with the functions compose(), append_chunks()
or prepend_chunks().
It should be used inside a call to as_paragraph().
Usage
as_chunk(x, props = NULL, formatter = format_fun, ...)
Arguments
x |
text or any element that can be formatted as text
with function provided in argument |
props |
an |
formatter |
a function that will format x as a character vector. |
... |
additional arguments for |
See Also
Other chunk elements for paragraph:
as_b(),
as_bracket(),
as_equation(),
as_highlight(),
as_i(),
as_image(),
as_qmd(),
as_strike(),
as_sub(),
as_sup(),
as_word_field(),
colorize(),
gg_chunk(),
grid_chunk(),
hyperlink_text(),
linerange(),
minibar(),
plot_chunk()
Examples
library(officer)

ft <- flextable(head(iris))

ft <- compose(ft,
  j = "Sepal.Length",
  value = as_paragraph(
    "Sepal.Length value is ",
    as_chunk(Sepal.Length, props = fp_text(color = "red"))
  ),
  part = "body"
)
ft <- color(ft, color = "gray40", part = "all")
ft <- autofit(ft)
ft
Equation chunk
Description
This function is used to insert equations into flextable.
It is used to add it to the content of a cell of the
flextable with the functions compose(), append_chunks()
or prepend_chunks().
To use this function, package 'equatags' is required;
also equatags::mathjax_install() must be executed only once
to install necessary dependencies.
Usage
as_equation(x, width = 1, height = 0.2, unit = "in", props = NULL)
Arguments
x |
values containing the 'MathJax' equations |
width, height |
size of the resulting equation |
unit |
unit for width and height, one of "in", "cm", "mm". |
props |
an |
See Also
Other chunk elements for paragraph:
as_b(),
as_bracket(),
as_chunk(),
as_highlight(),
as_i(),
as_image(),
as_qmd(),
as_strike(),
as_sub(),
as_sup(),
as_word_field(),
colorize(),
gg_chunk(),
grid_chunk(),
hyperlink_text(),
linerange(),
minibar(),
plot_chunk()
Examples
library(flextable)
if (require("equatags")) {
  eqs <- c(
    "(ax^2 + bx + c = 0)",
    "a \\ne 0",
    "x = {-b \\pm \\sqrt{b^2-4ac} \\over 2a}"
  )
  df <- data.frame(formula = eqs)
  df


  ft <- flextable(df)
  ft <- compose(
    x = ft, j = "formula",
    value = as_paragraph(as_equation(formula, width = 2, height = .5))
  )
  ft <- align(ft, align = "center", part = "all")
  ft <- width(ft, width = 2)
  ft
}
Method to transform objects into flextables
Description
This is a convenient function to let users create flextable bindings from any objects. Users should consult documentation of corresponding method to understand the details and see what arguments can be used.
Usage
as_flextable(x, ...)
Arguments
x |
object to be transformed as flextable |
... |
arguments for custom methods |
See Also
Other flextable constructors:
flextable()
Transform an rtables object into a flextable
Description
produce a flextable from a TableTree or
ElementaryTable object produced with the
'rtables' package.
The conversion uses formatters::matrix_form() to extract the
formatted content, column spans, alignments, indentation
and footnotes, then maps them to flextable features.
Indentation of row labels is rendered with left padding.
Label rows (LabelRow) are displayed in bold in the first column.
Content rows (ContentRow) are displayed entirely in bold.
When LabelRow groups exist, paginate() is applied so
that all rows belonging to the same group are kept together
on the same page in Word and RTF output.
To paginate the resulting flextable into multiple pages, use
split_to_pages(), split_rows(), or split_columns() after
calling as_flextable().
Usage
## S3 method for class 'TableTree'
as_flextable(x, indent_padding = 4, ...)

## S3 method for class 'ElementaryTable'
as_flextable(x, indent_padding = 4, ...)
Arguments
x |
a |
indent_padding |
base left padding in points per indentation
level. Default is |
... |
unused arguments |
Value
a flextable object.
See Also
split_to_pages(), split_rows(), split_columns()
Examples
if (require("rtables", character.only = TRUE, quietly = TRUE)) {
  library(rtables)

  lyt <- basic_table(title = "Demographic Summary") %>%
    split_cols_by("ARM") %>%
    split_rows_by("SEX") %>%
    analyze("AGE", afun = mean, format = "xx.x")

  tbl <- build_table(lyt, DM)
  as_flextable(tbl)
}
Transform a 'compact_summary' object into a flextable
Description
compact_summary objects can be transformed into
a flextable with method as_flextable().
Numeric columns are formatted with formatC() using the
digits value stored in the object and the current
flextable defaults for big.mark and decimal.mark.
Usage
## S3 method for class 'compact_summary'
as_flextable(x, ...)
Arguments
x |
A |
... |
unused arguments. |
Value
A flextable() object.
See Also
Other as_flextable methods:
as_flextable.data.frame(),
as_flextable.gam(),
as_flextable.glm(),
as_flextable.grouped_data(),
as_flextable.htest(),
as_flextable.kmeans(),
as_flextable.lm(),
as_flextable.merMod(),
as_flextable.pam(),
as_flextable.summarizor(),
as_flextable.table(),
as_flextable.tabular(),
as_flextable.tabulator(),
as_flextable.xtable(),
compact_summary()
Examples
z <- compact_summary(iris, show_type = TRUE, show_na = TRUE)
as_flextable(z)
Transform and summarise a 'data.frame' into a flextable Simple summary of a data.frame as a flextable
Description
It displays the first rows and shows the column types. If there is only one row, a simplified vertical table is produced.
Usage
## S3 method for class 'data.frame'
as_flextable(
  x,
  max_row = 10,
  split_colnames = FALSE,
  short_strings = FALSE,
  short_size = 35,
  short_suffix = "...",
  do_autofit = TRUE,
  show_coltype = TRUE,
  color_coltype = "#999999",
  ...
)
Arguments
x |
a data.frame |
max_row |
The number of rows to print. Default to 10. |
split_colnames |
Should the column names be split (with non alpha-numeric characters). Default to FALSE. |
short_strings |
Should the character column be shorten. Default to FALSE. |
short_size |
Maximum length of character column if
|
short_suffix |
Suffix to add when character values are shorten. Default to "...". |
do_autofit |
Use |
show_coltype |
Show column types. Default to TRUE. |
color_coltype |
Color to use for column types. Default to "#999999". |
... |
unused arguments |
See Also
Other as_flextable methods:
as_flextable.compact_summary(),
as_flextable.gam(),
as_flextable.glm(),
as_flextable.grouped_data(),
as_flextable.htest(),
as_flextable.kmeans(),
as_flextable.lm(),
as_flextable.merMod(),
as_flextable.pam(),
as_flextable.summarizor(),
as_flextable.table(),
as_flextable.tabular(),
as_flextable.tabulator(),
as_flextable.xtable(),
compact_summary()
Examples
as_flextable(mtcars)
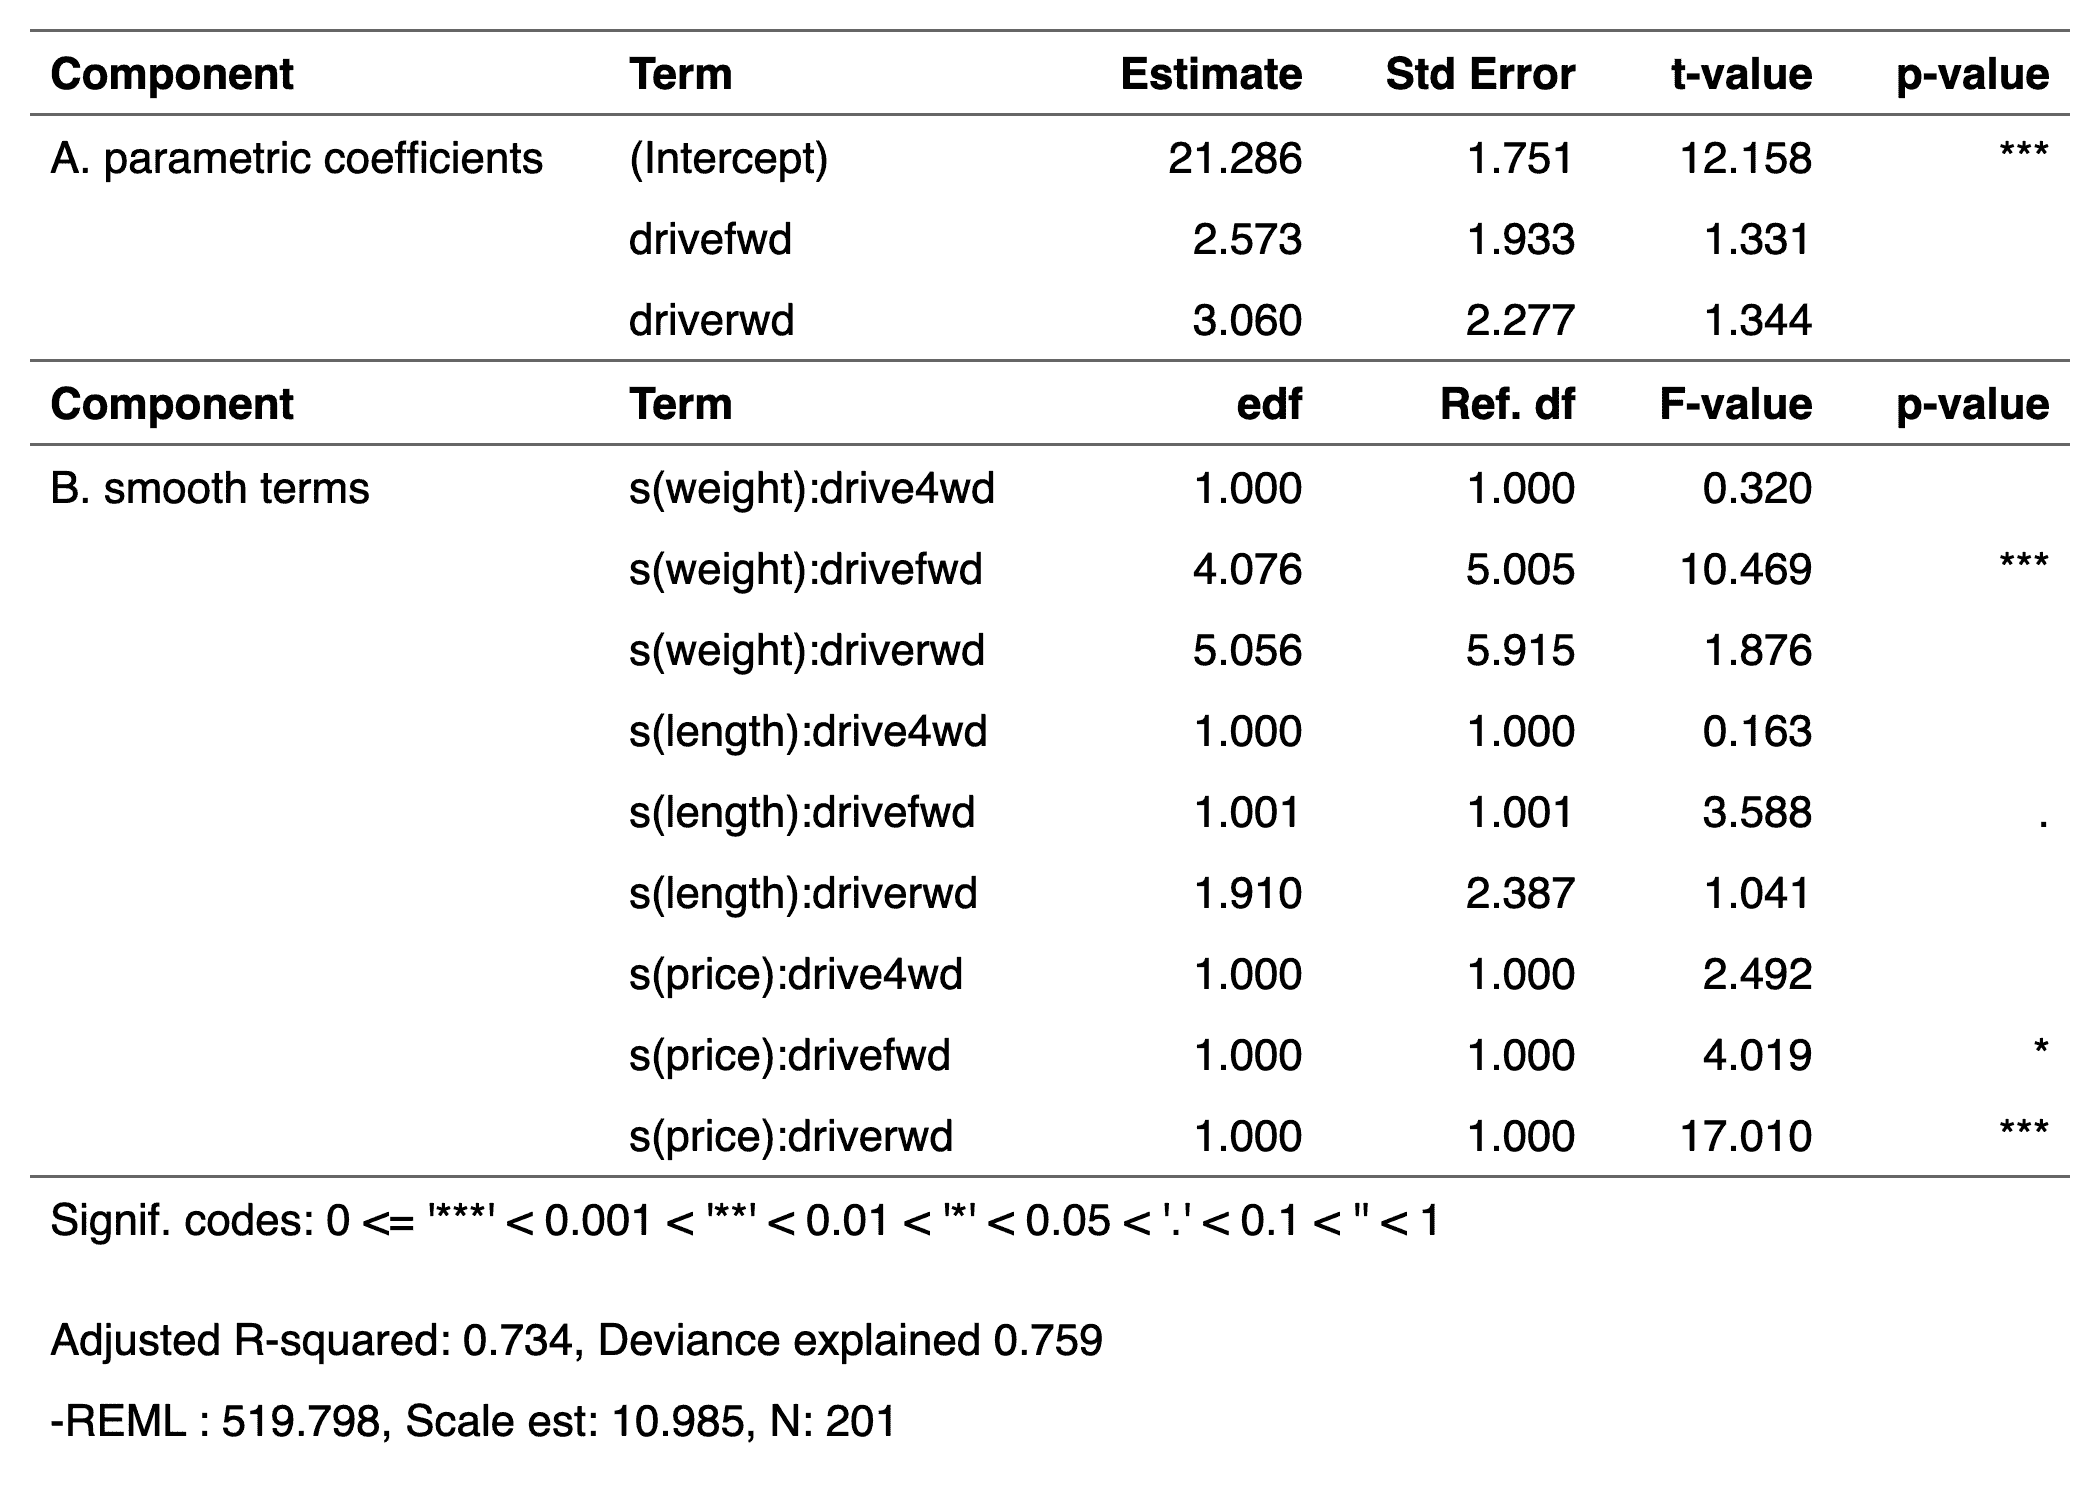
Transform a 'gam' model into a flextable
Description
produce a flextable describing a
generalized additive model produced by function mgcv::gam.
Usage
## S3 method for class 'gam'
as_flextable(x, ...)
Arguments
x |
gam model |
... |
unused argument |
See Also
Other as_flextable methods:
as_flextable.compact_summary(),
as_flextable.data.frame(),
as_flextable.glm(),
as_flextable.grouped_data(),
as_flextable.htest(),
as_flextable.kmeans(),
as_flextable.lm(),
as_flextable.merMod(),
as_flextable.pam(),
as_flextable.summarizor(),
as_flextable.table(),
as_flextable.tabular(),
as_flextable.tabulator(),
as_flextable.xtable(),
compact_summary()
Examples
if (require("mgcv")) {
  set.seed(2)

  # Simulated data
  dat <- gamSim(1, n = 400, dist = "normal", scale = 2)

  # basic GAM model
  b <- gam(y ~ s(x0) + s(x1) + s(x2) + s(x3), data = dat)

  ft <- as_flextable(b)
  ft
}
Transform a 'glm' object into a flextable
Description
produce a flextable describing a
generalized linear model produced by function glm.
You can remove significance stars by setting options
options(show.signif.stars = FALSE).
Usage
## S3 method for class 'glm'
as_flextable(x, ...)
Arguments
x |
glm model |
... |
unused argument |
See Also
Other as_flextable methods:
as_flextable.compact_summary(),
as_flextable.data.frame(),
as_flextable.gam(),
as_flextable.grouped_data(),
as_flextable.htest(),
as_flextable.kmeans(),
as_flextable.lm(),
as_flextable.merMod(),
as_flextable.pam(),
as_flextable.summarizor(),
as_flextable.table(),
as_flextable.tabular(),
as_flextable.tabulator(),
as_flextable.xtable(),
compact_summary()
Examples
if (require("broom")) {
  dat <- attitude
  dat$high.rating <- (dat$rating > 70)
  probit.model <- glm(high.rating ~ learning + critical +
    advance, data = dat, family = binomial(link = "probit"))
  ft <- as_flextable(probit.model)
  ft
}
Transform a 'grouped_data' object into a flextable
Description
Produce a flextable from a table
produced by function as_grouped_data().
Usage
## S3 method for class 'grouped_data'
as_flextable(x, col_keys = NULL, hide_grouplabel = FALSE, ...)
Arguments
x |
'grouped_data' object to be transformed into a "flextable" |
col_keys |
columns names/keys to display. If some column names are not in the dataset, they will be added as blank columns by default. |
hide_grouplabel |
if TRUE, group label will not be rendered, only level/value will be rendered. |
... |
unused argument |
See Also
Other as_flextable methods:
as_flextable.compact_summary(),
as_flextable.data.frame(),
as_flextable.gam(),
as_flextable.glm(),
as_flextable.htest(),
as_flextable.kmeans(),
as_flextable.lm(),
as_flextable.merMod(),
as_flextable.pam(),
as_flextable.summarizor(),
as_flextable.table(),
as_flextable.tabular(),
as_flextable.tabulator(),
as_flextable.xtable(),
compact_summary()
Examples
library(data.table)
CO2 <- CO2
setDT(CO2)
CO2$conc <- as.integer(CO2$conc)

data_co2 <- dcast(CO2, Treatment + conc ~ Type,
  value.var = "uptake", fun.aggregate = mean
)
data_co2 <- as_grouped_data(x = data_co2, groups = c("Treatment"))

ft <- as_flextable(data_co2)
ft <- add_footer_lines(ft, "dataset CO2 has been used for this flextable")
ft <- add_header_lines(ft, "mean of carbon dioxide uptake in grass plants")
ft <- set_header_labels(ft, conc = "Concentration")
ft <- autofit(ft)
ft <- width(ft, width = c(1, 1, 1))
ft
Transform a 'htest' object into a flextable
Description
produce a flextable describing an
object oof class htest.
Usage
## S3 method for class 'htest'
as_flextable(x, ...)
Arguments
x |
htest object |
... |
unused argument |
See Also
Other as_flextable methods:
as_flextable.compact_summary(),
as_flextable.data.frame(),
as_flextable.gam(),
as_flextable.glm(),
as_flextable.grouped_data(),
as_flextable.kmeans(),
as_flextable.lm(),
as_flextable.merMod(),
as_flextable.pam(),
as_flextable.summarizor(),
as_flextable.table(),
as_flextable.tabular(),
as_flextable.tabulator(),
as_flextable.xtable(),
compact_summary()
Examples
if (require("stats")) {
  M <- as.table(rbind(c(762, 327, 468), c(484, 239, 477)))
  dimnames(M) <- list(
    gender = c("F", "M"),
    party = c("Democrat", "Independent", "Republican")
  )
  ft_1 <- as_flextable(chisq.test(M))
  ft_1
}
Transform a 'kmeans' object into a flextable
Description
produce a flextable describing a kmeans object. The function is only using package 'broom' that provides the data presented in the resulting flextable.
Usage
## S3 method for class 'kmeans'
as_flextable(x, digits = 4, ...)
Arguments
x |
a |
digits |
number of digits for the numeric columns |
... |
unused argument |
See Also
Other as_flextable methods:
as_flextable.compact_summary(),
as_flextable.data.frame(),
as_flextable.gam(),
as_flextable.glm(),
as_flextable.grouped_data(),
as_flextable.htest(),
as_flextable.lm(),
as_flextable.merMod(),
as_flextable.pam(),
as_flextable.summarizor(),
as_flextable.table(),
as_flextable.tabular(),
as_flextable.tabulator(),
as_flextable.xtable(),
compact_summary()
Examples
if (require("stats")) {
  cl <- kmeans(scale(mtcars[1:7]), 5)
  ft <- as_flextable(cl)
  ft
}
Transform a 'lm' object into a flextable
Description
produce a flextable describing a
linear model produced by function lm.
You can remove significance stars by setting options
options(show.signif.stars = FALSE).
Usage
## S3 method for class 'lm'
as_flextable(x, ...)
Arguments
x |
lm model |
... |
unused argument |
See Also
Other as_flextable methods:
as_flextable.compact_summary(),
as_flextable.data.frame(),
as_flextable.gam(),
as_flextable.glm(),
as_flextable.grouped_data(),
as_flextable.htest(),
as_flextable.kmeans(),
as_flextable.merMod(),
as_flextable.pam(),
as_flextable.summarizor(),
as_flextable.table(),
as_flextable.tabular(),
as_flextable.tabulator(),
as_flextable.xtable(),
compact_summary()
Examples
if (require("broom")) {
  lmod <- lm(rating ~ complaints + privileges +
    learning + raises + critical, data = attitude)
  ft <- as_flextable(lmod)
  ft
}
Transform a 'merMod' or 'lme' object into a flextable
Description
produce a flextable describing a mixed model. The function is only using package 'broom.mixed' that provides the data presented in the resulting flextable.
You can remove significance stars by setting options
options(show.signif.stars = FALSE).
Usage
## S3 method for class 'merMod'
as_flextable(x, add.random = TRUE, ...)

## S3 method for class 'lme'
as_flextable(x, add.random = TRUE, ...)

## S3 method for class 'gls'
as_flextable(x, add.random = TRUE, ...)

## S3 method for class 'nlme'
as_flextable(x, add.random = TRUE, ...)

## S3 method for class 'brmsfit'
as_flextable(x, add.random = TRUE, ...)

## S3 method for class 'glmmTMB'
as_flextable(x, add.random = TRUE, ...)

## S3 method for class 'glmmadmb'
as_flextable(x, add.random = TRUE, ...)
Arguments
x |
a mixed model |
add.random |
TRUE or FALSE, if TRUE random effects are added to the table. |
... |
unused argument |
See Also
Other as_flextable methods:
as_flextable.compact_summary(),
as_flextable.data.frame(),
as_flextable.gam(),
as_flextable.glm(),
as_flextable.grouped_data(),
as_flextable.htest(),
as_flextable.kmeans(),
as_flextable.lm(),
as_flextable.pam(),
as_flextable.summarizor(),
as_flextable.table(),
as_flextable.tabular(),
as_flextable.tabulator(),
as_flextable.xtable(),
compact_summary()
Examples
if (require("broom.mixed") && require("nlme")) {
  m1 <- lme(distance ~ age, data = Orthodont)
  ft <- as_flextable(m1)
  ft
}
Transform a 'pam' object into a flextable
Description
produce a flextable describing a pam object. The function is only using package 'broom' that provides the data presented in the resulting flextable.
Usage
## S3 method for class 'pam'
as_flextable(x, digits = 4, ...)
Arguments
x |
a |
digits |
number of digits for the numeric columns |
... |
unused argument |
See Also
Other as_flextable methods:
as_flextable.compact_summary(),
as_flextable.data.frame(),
as_flextable.gam(),
as_flextable.glm(),
as_flextable.grouped_data(),
as_flextable.htest(),
as_flextable.kmeans(),
as_flextable.lm(),
as_flextable.merMod(),
as_flextable.summarizor(),
as_flextable.table(),
as_flextable.tabular(),
as_flextable.tabulator(),
as_flextable.xtable(),
compact_summary()
Examples
if (require("cluster")) {
  dat <- as.data.frame(scale(mtcars[1:7]))
  cl <- pam(dat, 3)
  ft <- as_flextable(cl)
  ft
}
Transform a 'summarizor' object into a flextable
Description
summarizor object should be transformed into a flextable
with method as_flextable().
Usage
## S3 method for class 'summarizor'
as_flextable(x, ...)
Arguments
x |
result from |
... |
arguments for |
See Also
Other as_flextable methods:
as_flextable.compact_summary(),
as_flextable.data.frame(),
as_flextable.gam(),
as_flextable.glm(),
as_flextable.grouped_data(),
as_flextable.htest(),
as_flextable.kmeans(),
as_flextable.lm(),
as_flextable.merMod(),
as_flextable.pam(),
as_flextable.table(),
as_flextable.tabular(),
as_flextable.tabulator(),
as_flextable.xtable(),
compact_summary()
Examples
z <- summarizor(CO2[-c(1, 4)],
  by = "Treatment",
  overall_label = "Overall"
)
ft_1 <- as_flextable(z, spread_first_col = TRUE)
ft_1 <- prepend_chunks(ft_1,
  i = ~ is.na(variable), j = 1,
  as_chunk("\t")
)
ft_1 <- autofit(ft_1)
ft_1
Transform a 'table' object into a flextable
Description
produce a flextable describing a
count table produced by function table().
This function uses the proc_freq() function.
Usage
## S3 method for class 'table'
as_flextable(x, ...)
Arguments
x |
table object |
... |
arguments used by |
See Also
Other as_flextable methods:
as_flextable.compact_summary(),
as_flextable.data.frame(),
as_flextable.gam(),
as_flextable.glm(),
as_flextable.grouped_data(),
as_flextable.htest(),
as_flextable.kmeans(),
as_flextable.lm(),
as_flextable.merMod(),
as_flextable.pam(),
as_flextable.summarizor(),
as_flextable.tabular(),
as_flextable.tabulator(),
as_flextable.xtable(),
compact_summary()
Examples
tab <- with(warpbreaks, table(wool, tension))
ft <- as_flextable(tab)
ft
Transform a 'tables::tabular' object into a flextable
Description
Produce a flextable from a 'tabular' object
produced with function tables::tabular().
When as_flextable.tabular=TRUE, the first column is
used as row separator acting as a row title. It can
be formated with arguments fp_p (the formatting
properties of the paragraph) and row_title that
specifies the content and eventually formattings
of the content.
Two hidden columns can be used for conditional formatting
after the creation of the flextable (use only when
spread_first_col=TRUE):
The column
.row_titlethat contains the title labelThe column
.typethat can contain the following values:"one_row": Indicates that there is only one row for this group. In this case, the row is not expanded with a title above.
"list_title": Indicates a row that serves as a title for the data that are displayed after it.
"list_data": Indicates rows that follow a title and contain data to be displayed.
The result is paginated (see paginate()).
Usage
## S3 method for class 'tabular'
as_flextable(
  x,
  spread_first_col = FALSE,
  fp_p = fp_par(text.align = "center", padding.top = 4),
  row_title = as_paragraph(as_chunk(.row_title)),
  add_tab = FALSE,
  ...
)
Arguments
x |
object produced by |
spread_first_col |
if TRUE, first row is spread as a new line separator instead of being a column. This helps to reduce the width and allows for clear divisions. |
fp_p |
paragraph formatting properties associated with row titles,
see |
row_title |
a call to |
add_tab |
adds a tab in front of "list_data"
label lines (located in column |
... |
unused argument |
See Also
Other as_flextable methods:
as_flextable.compact_summary(),
as_flextable.data.frame(),
as_flextable.gam(),
as_flextable.glm(),
as_flextable.grouped_data(),
as_flextable.htest(),
as_flextable.kmeans(),
as_flextable.lm(),
as_flextable.merMod(),
as_flextable.pam(),
as_flextable.summarizor(),
as_flextable.table(),
as_flextable.tabulator(),
as_flextable.xtable(),
compact_summary()
Examples
if (require("tables")) {
set.seed(42)
genders <- c("Male", "Female")
status <- c("low", "medium", "high")
Sex <- factor(sample(genders, 100, rep = TRUE))
Status <- factor(sample(status, 100, rep = TRUE))
z <- rnorm(100) + 5
fmt <- function(x) {
s <- format(x, digits = 2)
even <- ((1:length(s)) %% 2) == 0
s[even] <- sprintf("(%s)", s[even])
s
}
tab <- tabular(
Justify(c) * Heading() * z *
Sex * Heading(Statistic) *
Format(fmt()) *
(mean + sd) ~ Status
)
as_flextable(tab)
}
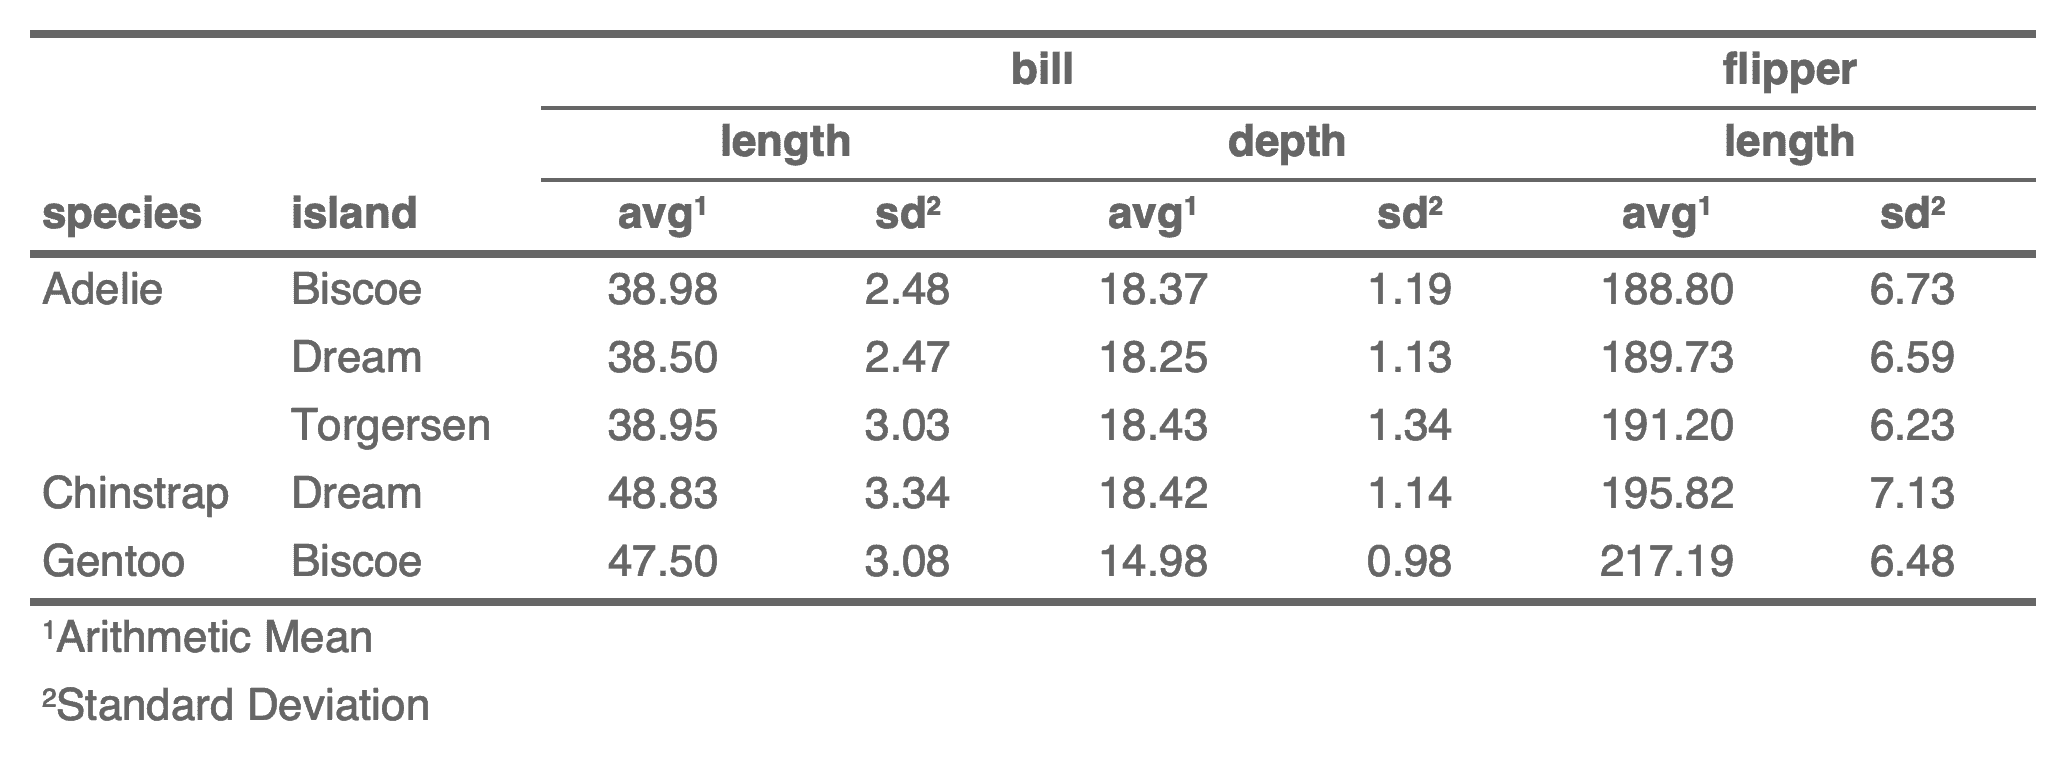
if (require("tables")) {
tab <- tabular(
(Species + 1) ~ (n = 1) + Format(digits = 2) *
(Sepal.Length + Sepal.Width) * (mean + sd),
data = iris
)
as_flextable(tab)
}
if (require("tables")) {
x <- tabular((Factor(gear, "Gears") + 1)
* ((n = 1) + Percent()
+ (RowPct = Percent("row"))
+ (ColPct = Percent("col")))
~ (Factor(carb, "Carburetors") + 1)
* Format(digits = 1), data = mtcars)
ft <- as_flextable(
x,
spread_first_col = TRUE,
row_title = as_paragraph(
colorize("Gears: ", color = "#666666"),
colorize(as_b(.row_title), color = "red")
)
)
ft
}
if (require("tables")) {
tab <- tabular(
(mean + mean) * (Sepal.Length + Sepal.Width) ~ 1,
data = iris
)
as_flextable(tab)
}
Transform a 'tabulator' object into a flextable
Description
tabulator() object can be transformed as a flextable
with method as_flextable().
Usage
## S3 method for class 'tabulator'
as_flextable(
  x,
  separate_with = character(0),
  big_border = fp_border_default(width = 1.5),
  small_border = fp_border_default(width = 0.75),
  rows_alignment = "left",
  columns_alignment = "center",
  label_rows = x$rows,
  spread_first_col = FALSE,
  expand_single = FALSE,
  sep_w = 0.05,
  unit = "in",
  ...
)
Arguments
x |
result from |
separate_with |
columns used to sepatate the groups with an horizontal line. |
big_border, small_border |
big and small border properties defined
by a call to |
rows_alignment, columns_alignment |
alignments to apply to
columns corresponding to |
label_rows |
labels to use for the first column names, i.e. the row column names. It must be a named vector, the values will be matched based on the names. |
spread_first_col |
if TRUE, first row is spread as a new line separator instead of being a column. This helps to reduce the width and allows for clear divisions. |
expand_single |
if FALSE (the default), groups with only one row will not be expanded with a title row. If TRUE, single row groups and multi-row groups are all restructured. |
sep_w |
blank column separators'width to be used. If 0, blank column separators will not be used. |
unit |
unit of argument |
... |
unused argument |
See Also
summarizor(), as_grouped_data()
Other as_flextable methods:
as_flextable.compact_summary(),
as_flextable.data.frame(),
as_flextable.gam(),
as_flextable.glm(),
as_flextable.grouped_data(),
as_flextable.htest(),
as_flextable.kmeans(),
as_flextable.lm(),
as_flextable.merMod(),
as_flextable.pam(),
as_flextable.summarizor(),
as_flextable.table(),
as_flextable.tabular(),
as_flextable.xtable(),
compact_summary()
Examples
## Not run:
library(flextable)

set_flextable_defaults(digits = 2, border.color = "gray")

if (require("stats")) {
  dat <- aggregate(breaks ~ wool + tension,
    data = warpbreaks, mean
  )

  cft_1 <- tabulator(
    x = dat,
    rows = "wool",
    columns = "tension",
    `mean` = as_paragraph(as_chunk(breaks)),
    `(N)` = as_paragraph(
      as_chunk(length(breaks))
    )
  )

  ft_1 <- as_flextable(cft_1, sep_w = .1)
  ft_1
}

if (require("stats")) {
  set_flextable_defaults(
    padding = 1, font.size = 9,
    border.color = "orange"
  )

  ft_2 <- as_flextable(cft_1, sep_w = 0)
  ft_2
}

if (require("stats")) {
  set_flextable_defaults(
    padding = 6, font.size = 11,
    border.color = "white",
    font.color = "white",
    background.color = "#333333"
  )

  ft_3 <- as_flextable(
    x = cft_1, sep_w = 0,
    rows_alignment = "center",
    columns_alignment = "right"
  )
  ft_3
}

init_flextable_defaults()

## End(Not run)
Transform a 'xtable' object into a flextable
Description
Get a flextable object from
a xtable object.
Usage
## S3 method for class 'xtable'
as_flextable(
  x,
  text.properties = fp_text_default(),
  format.args = getOption("xtable.format.args", NULL),
  rowname_col = "rowname",
  hline.after = getOption("xtable.hline.after", c(-1, 0, nrow(x))),
  NA.string = getOption("xtable.NA.string", ""),
  include.rownames = TRUE,
  rotate.colnames = getOption("xtable.rotate.colnames", FALSE),
  ...
)
Arguments
x |
|
text.properties |
default text formatting properties |
format.args |
List of arguments for the formatC function.
See argument |
rowname_col |
colname used for row names column |
hline.after |
see |
NA.string |
see |
include.rownames |
see |
rotate.colnames |
see |
... |
unused arguments |
See Also
Other as_flextable methods:
as_flextable.compact_summary(),
as_flextable.data.frame(),
as_flextable.gam(),
as_flextable.glm(),
as_flextable.grouped_data(),
as_flextable.htest(),
as_flextable.kmeans(),
as_flextable.lm(),
as_flextable.merMod(),
as_flextable.pam(),
as_flextable.summarizor(),
as_flextable.table(),
as_flextable.tabular(),
as_flextable.tabulator(),
compact_summary()
Examples
library(officer)
if( require("xtable") ){

  data(tli)
  tli.table <- xtable(tli[1:10, ])
  align(tli.table) <- rep("r", 6)
  align(tli.table) <- "|r|r|clr|r|"
  ft_1 <- as_flextable(
    tli.table,
    rotate.colnames = TRUE,
    include.rownames = FALSE)
  ft_1 <- height(ft_1, i = 1, part = "header", height = 1)
  ft_1


  Grade3 <- c("A","B","B","A","B","C","C","D","A","B",
    "C","C","C","D","B","B","D","C","C","D")
  Grade6 <- c("A","A","A","B","B","B","B","B","C","C",
    "A","C","C","C","D","D","D","D","D","D")
  Cohort <- table(Grade3, Grade6)
  ft_2 <- as_flextable(xtable(Cohort))
  ft_2 <- set_header_labels(ft_2, rowname = "Grade 3")
  ft_2 <- autofit(ft_2)
  ft_2 <- add_header(ft_2, A = "Grade 6")
  ft_2 <- merge_at(ft_2, i = 1, j = seq_len( ncol(Cohort) ) + 1,
    part = "header" )
  ft_2 <- bold(ft_2, j = 1, bold = TRUE, part = "body")
  ft_2 <- height_all(ft_2, part = "header", height = .4)
  ft_2

  temp.ts <- ts(cumsum(1 + round(rnorm(100), 0)),
    start = c(1954, 7), frequency = 12)
  ft_3 <- as_flextable(x = xtable(temp.ts, digits = 0),
    NA.string = "-")
  ft_3

  detach("package:xtable", unload = TRUE)
}
Insert group-label rows into a data frame
Description
Repeated consecutive values of group columns will be used to define the title of the groups and will be added as a row title.
Usage
as_grouped_data(x, groups, columns = NULL, expand_single = TRUE)
Arguments
x |
dataset |
groups |
columns names to be used as row separators. |
columns |
columns names to keep |
expand_single |
if FALSE, groups with only one row will not be expanded with a title row. If TRUE (the default), single row groups and multi-row groups are all restructured. |
See Also
Examples
# as_grouped_data -----
library(data.table)
CO2 <- CO2
setDT(CO2)
CO2$conc <- as.integer(CO2$conc)

data_co2 <- dcast(CO2, Treatment + conc ~ Type,
  value.var = "uptake", fun.aggregate = mean
)
data_co2
data_co2 <- as_grouped_data(x = data_co2, groups = c("Treatment"))
data_co2
Highlight chunk
Description
The function is producing a chunk with an highlight chunk.
It is used to add it to the content of a cell of the
flextable with the functions compose(), append_chunks()
or prepend_chunks().
Usage
as_highlight(x, color)
Arguments
x |
value, if a chunk, the chunk will be updated |
color |
color to use as text highlighting color as character vector. |
See Also
Other chunk elements for paragraph:
as_b(),
as_bracket(),
as_chunk(),
as_equation(),
as_i(),
as_image(),
as_qmd(),
as_strike(),
as_sub(),
as_sup(),
as_word_field(),
colorize(),
gg_chunk(),
grid_chunk(),
hyperlink_text(),
linerange(),
minibar(),
plot_chunk()
Examples
ft <- flextable(head(iris),
  col_keys = c("Sepal.Length", "dummy")
)

ft <- compose(ft,
  j = "dummy",
  value = as_paragraph(as_highlight(Sepal.Length, color = "yellow"))
)

ft
Italic chunk
Description
The function is producing a chunk with italic font.
It is used to add it to the content of a cell of the
flextable with the functions compose(), append_chunks()
or prepend_chunks().
Usage
as_i(x)
Arguments
x |
value, if a chunk, the chunk will be updated |
See Also
Other chunk elements for paragraph:
as_b(),
as_bracket(),
as_chunk(),
as_equation(),
as_highlight(),
as_image(),
as_qmd(),
as_strike(),
as_sub(),
as_sup(),
as_word_field(),
colorize(),
gg_chunk(),
grid_chunk(),
hyperlink_text(),
linerange(),
minibar(),
plot_chunk()
Examples
ft <- flextable(head(iris),
  col_keys = c("Sepal.Length", "dummy")
)

ft <- compose(ft,
  j = "dummy",
  value = as_paragraph(as_i(Sepal.Length))
)

ft
Image chunk
Description
The function lets add images within flextable objects with functions:
Usage
as_image(
  src,
  width = NULL,
  height = NULL,
  unit = "in",
  guess_size = TRUE,
  alt = "",
  ...
)
Arguments
src |
image filename |
width, height |
size of the image file. It can be ignored
if parameter |
unit |
unit for width and height, one of "in", "cm", "mm". |
guess_size |
If package 'magick' is installed, this option
can be used (set it to |
alt |
alternative text for the image (used for accessibility) |
... |
unused argument |
Note
This chunk option requires package officedown in a R Markdown
context with Word output format. With Quarto (format: docx) or
rmarkdown::word_document(), the resulting file must be repaired
with repair_docx().
PowerPoint cannot mix images and text in a paragraph, images are removed when outputing to PowerPoint format.
See Also
Other chunk elements for paragraph:
as_b(),
as_bracket(),
as_chunk(),
as_equation(),
as_highlight(),
as_i(),
as_qmd(),
as_strike(),
as_sub(),
as_sup(),
as_word_field(),
colorize(),
gg_chunk(),
grid_chunk(),
hyperlink_text(),
linerange(),
minibar(),
plot_chunk()
Examples
img.file <- file.path(
  R.home("doc"),
  "html", "logo.jpg"
)
if (require("magick")) {
  myft <- flextable(head(iris))
  myft <- compose(myft,
    i = 1:3, j = 1,
    value = as_paragraph(
      as_image(src = img.file),
      " ",
      as_chunk(Sepal.Length,
        props = fp_text_default(color = "red")
      )
    ),
    part = "body"
  )
  ft <- autofit(myft)
  ft
}
Build a paragraph from chunks
Description
as_paragraph() assembles one or more chunks into a single paragraph
that defines the content of a flextable cell. Each cell in a flextable
contains exactly one paragraph; a paragraph is an ordered sequence of
chunks.
Chunks are the smallest content units and can be created with
as_chunk() (formatted text), as_b() / as_i() (bold / italic
shortcuts), minibar() (inline bar), as_image() (image),
gg_chunk() (ggplot), as_equation() (equation) or
hyperlink_text() (link). Plain character strings passed to
as_paragraph() are automatically converted to chunks via
as_chunk().
The resulting paragraph is passed to the value argument of
compose(), mk_par(), add_header_lines(),
add_footer_lines() or footnote() to set cell content.
Usage
as_paragraph(..., list_values = NULL)
Arguments
... |
chunk elements that are defining the paragraph content.
If a character is used, it is transformed to a chunk object with
function |
list_values |
a list of chunk elements that are defining
the paragraph content. If specified argument |
See Also
as_chunk(), minibar(),
as_image(), hyperlink_text()
Other functions to compose cell content:
append_chunks(),
compose(),
footnote(),
labelizor(),
prepend_chunks(),
void()
Examples
library(flextable)
ft <- flextable(airquality[sample.int(150, size = 10), ])
ft <- compose(ft,
  j = "Wind",
  value = as_paragraph(
    as_chunk(Wind, props = fp_text_default(color = "orange")),
    " ",
    minibar(value = Wind, max = max(airquality$Wind), barcol = "orange", bg = "black", height = .15)
  ),
  part = "body"
)
ft <- autofit(ft)
ft
Quarto inline markdown chunk
Description
as_qmd() creates a chunk for inline Quarto markdown
content (text-level) that fits within a table
cell paragraph. This enables cross-references
(@fig-xxx, @tbl-xxx), links, bold/italic, math,
inline code, shortcodes and other inline Quarto markdown
features inside flextable cells.
It is not designed for block-level elements such as headings, bullet lists or fenced code blocks.
The chunk is used with compose(), append_chunks()
or prepend_chunks(). It requires the flextable-qmd Lua
filter extension (see use_flextable_qmd()) and works with
HTML, PDF, Typst and Word (docx) Quarto output formats.
Usage
as_qmd(x, display = x)
Arguments
x |
character vector of Quarto markdown content. |
display |
character vector of display text used
as fallback when the Lua filter is not active.
Defaults to |
Setup
Install the extension once per project:
flextable::use_flextable_qmd()
Add the filter to your Quarto document YAML. For HTML and PDF, a single line is enough:
filters:
  - flextable-qmd
For Word (docx), an additional post-render filter removes the wrapper table that Quarto adds around labelled flextables:
filters:
  - flextable-qmd
  - at: post-render
    path: _extensions/flextable-qmd/unwrap-float.lua
Supported markdown
Cross-references:
@fig-xxx,@tbl-xxxBold / italic:
**bold**,*italic*Inline code:
`code`Links:
[text](url)(internal and external)Math:
$\\alpha + \\beta$Shortcodes and other Quarto markdown constructs
Limitations
Each table cell in a flextable contains a single paragraph
built from inline chunks (see as_paragraph()). There is no
mechanism to insert block-level structures (multiple
paragraphs, lists, headings, fenced code blocks, callouts,
etc.) inside a cell. Because as_qmd() produces one of
these inline chunks, only inline markdown is supported.
See Also
use_flextable_qmd() to install the Lua filter extension,
knit_print.flextable() for rendering options in knitr documents.
Other chunk elements for paragraph:
as_b(),
as_bracket(),
as_chunk(),
as_equation(),
as_highlight(),
as_i(),
as_image(),
as_strike(),
as_sub(),
as_sup(),
as_word_field(),
colorize(),
gg_chunk(),
grid_chunk(),
hyperlink_text(),
linerange(),
minibar(),
plot_chunk()
Examples
library(flextable)

dat <- data.frame(
  label = c("Bold", "Link", "Code"),
  content = c(
    "This is **bold** text",
    "Visit [Quarto](https://quarto.org)",
    "Use `print()` here"
  )
)
ft <- flextable(dat)
ft <- mk_par(ft, j = "content",
  value = as_paragraph(as_qmd(content)))
ft
Transform a flextable into a raster
Description
Function is now defunct, use gen_grob() instead.
Usage
as_raster(...)
Arguments
... |
unused |
Strikethrough chunk
Description
The function is producing a chunk with strikethrough font.
It is used to add it to the content of a cell of the
flextable with the functions compose(), append_chunks()
or prepend_chunks().
Usage
as_strike(x)
Arguments
x |
value, if a chunk, the chunk will be updated |
See Also
Other chunk elements for paragraph:
as_b(),
as_bracket(),
as_chunk(),
as_equation(),
as_highlight(),
as_i(),
as_image(),
as_qmd(),
as_sub(),
as_sup(),
as_word_field(),
colorize(),
gg_chunk(),
grid_chunk(),
hyperlink_text(),
linerange(),
minibar(),
plot_chunk()
Examples
ft <- flextable(head(iris),
  col_keys = c("Sepal.Length", "dummy")
)

ft <- compose(ft,
  j = "dummy",
  value = as_paragraph(
    as_strike(Sepal.Length)
  )
)

ft
Subscript chunk
Description
The function is producing a chunk with subscript vertical alignment.
It is used to add it to the content of a cell of the
flextable with the functions compose(), append_chunks()
or prepend_chunks().
Usage
as_sub(x)
Arguments
x |
value, if a chunk, the chunk will be updated |
See Also
Other chunk elements for paragraph:
as_b(),
as_bracket(),
as_chunk(),
as_equation(),
as_highlight(),
as_i(),
as_image(),
as_qmd(),
as_strike(),
as_sup(),
as_word_field(),
colorize(),
gg_chunk(),
grid_chunk(),
hyperlink_text(),
linerange(),
minibar(),
plot_chunk()
Examples
ft <- flextable(head(iris), col_keys = c("dummy"))

ft <- compose(ft,
  i = 1, j = "dummy", part = "header",
  value = as_paragraph(
    as_sub("Sepal.Length"),
    " anything "
  )
)

ft <- autofit(ft)
ft
Superscript chunk
Description
The function is producing a chunk with superscript vertical alignment.
It is used to add it to the content of a cell of the
flextable with the functions compose(), append_chunks()
or prepend_chunks().
Usage
as_sup(x)
Arguments
x |
value, if a chunk, the chunk will be updated |
Note
This is a sugar function that ease the composition of complex
labels made of different formattings. It should be used inside a
call to as_paragraph().
See Also
Other chunk elements for paragraph:
as_b(),
as_bracket(),
as_chunk(),
as_equation(),
as_highlight(),
as_i(),
as_image(),
as_qmd(),
as_strike(),
as_sub(),
as_word_field(),
colorize(),
gg_chunk(),
grid_chunk(),
hyperlink_text(),
linerange(),
minibar(),
plot_chunk()
Examples
ft <- flextable(head(iris), col_keys = c("dummy"))

ft <- compose(ft,
  i = 1, j = "dummy", part = "header",
  value = as_paragraph(
    " anything ",
    as_sup("Sepal.Width")
  )
)

ft <- autofit(ft)
ft
Word dynamic field chunk
Description
as_word_field() inserts a Word field code (e.g. page
numbers, dates, cross-references) as a chunk inside a
flextable cell. Field codes are Word's mechanism for
auto-computed values; see
Microsoft's field-code reference
for the available codes.
The chunk is used with compose(), append_chunks()
or prepend_chunks(). It only has an effect in Word
(docx) output; other formats ignore it. To apply it
conditionally, use the post-processing step (see
set_flextable_defaults(post_process_docx = ...)).
Important: fields are inserted but not computed.
After opening the document in Word, select all text
and press F9 (on macOS: Fn + F9) to refresh the
field values.
Usage
as_word_field(x, props = NULL, width = 0.1, height = 0.15, unit = "in")
Arguments
x |
computed field strings |
props |
text properties (see |
width, height |
size computed field |
unit |
unit for width and height, one of "in", "cm", "mm". |
See Also
Other chunk elements for paragraph:
as_b(),
as_bracket(),
as_chunk(),
as_equation(),
as_highlight(),
as_i(),
as_image(),
as_qmd(),
as_strike(),
as_sub(),
as_sup(),
colorize(),
gg_chunk(),
grid_chunk(),
hyperlink_text(),
linerange(),
minibar(),
plot_chunk()
Examples
library(flextable)

# define some default values ----
set_flextable_defaults(font.size = 22, border.color = "gray")

# an example with append_chunks ----
pp_docx <- function(x) {
  x <- add_header_lines(x, "Page ")
  x <- append_chunks(
    x = x, i = 1, part = "header", j = 1,
    as_word_field(x = "Page")
  )
  align(x, part = "header", align = "left")
}
ft_1 <- flextable(cars)
ft_1 <- autofit(ft_1)
ft_1 <- pp_docx(ft_1)

## or:
# set_flextable_defaults(post_process_docx = pp_docx)
## to prevent this line addition when output is not docx

# print(ft_1, preview = "docx")

# an example with compose ----

library(officer)
ft_2 <- flextable(head(cars))
ft_2 <- add_footer_lines(ft_2, "temp text")
ft_2 <- compose(
  x = ft_2, part = "footer", i = 1, j = 1,
  as_paragraph(
    "p. ",
    as_word_field(x = "Page", width = .05),
    " on ", as_word_field(x = "NumPages", width = .05)
  )
)
ft_2 <- autofit(ft_2, part = c("header", "body"))

doc <- read_docx()
doc <- body_add_flextable(doc, ft_2)
doc <- body_add_break(doc)
doc <- body_add_flextable(doc, ft_2)
outfile <- print(doc, target = tempfile(fileext = ".docx"))

# reset default values ----
init_flextable_defaults()
Adjust columns to their content size
Description
Compute and apply the minimum widths and heights needed
to display each cell's content on a single line, with an optional
extra margin (add_w, add_h).
This function sizes columns to fit their content. It does not
constrain the table to a given total width. To enforce a maximum
width, use fit_columns() (wraps text) or fit_to_width()
(shrinks font size).
Note that this function is not related to 'Microsoft Word' Autofit feature.
There is an alternative to fixed-width layouts that works
well with HTML and Word output that can be set
with set_table_properties(layout = "autofit"), see
set_table_properties().
Usage
autofit(
  x,
  add_w = 0.1,
  add_h = 0.1,
  part = c("body", "header"),
  unit = "in",
  hspans = "none"
)
Arguments
x |
a 'flextable' object, see flextable-package to learn how to create 'flextable' object. |
add_w |
extra width to add in inches |
add_h |
extra height to add in inches |
part |
part selector, see section Part selection with the |
unit |
unit for add_h and add_w, one of "in", "cm", "mm". |
hspans |
specifies how cells that are horizontally are included in the calculation. It must be one of the following values "none", "divided" or "included". If "none", widths of horizontally spanned cells is set to 0 (then do not affect the widths); if "divided", widths of horizontally spanned cells is divided by the number of spanned cells; if "included", all widths (included horizontally spanned cells) will be used in the calculation. |
See Also
Other functions for flextable size management:
dim.flextable(),
dim_pretty(),
fit_columns(),
fit_to_width(),
flextable_dim(),
height(),
hrule(),
ncol_keys(),
nrow_part(),
set_table_properties(),
width()
Examples
ft_1 <- flextable(head(mtcars))
ft_1
ft_2 <- autofit(ft_1)
ft_2
Detect rows before a given value
Description
Returns a logical vector indicating which elements
of x appear before the first occurrence of any of the
entries values. Useful as a row selector in hline() to
insert a border above a summary row such as "Total".
Usage
before(x, entries)
Arguments
x |
an atomic vector of values to be tested |
entries |
a sequence of items to be searched in |
See Also
Examples
library(flextable)
library(officer)

dat <- data.frame(
  stringsAsFactors = FALSE,
  check.names = FALSE,
  Level = c("setosa", "versicolor", "virginica", "<NA>", "Total"),
  Freq = as.integer(c(50, 50, 50, 0, 150)),
  `% Valid` = c(
    100 / 3,
    100 / 3, 100 / 3, NA, 100
  ),
  `% Valid Cum.` = c(100 / 3, 100 * 2 / 3, 100, NA, 100),
  `% Total` = c(
    100 / 3,
    100 / 3, 100 / 3, 0, 100
  ),
  `% Total Cum.` = c(
    100 / 3,
    100 * 2 / 3, 100, 100, 100
  )
)

ft <- flextable(dat)
ft <- hline(ft,
  i = ~ before(Level, "Total"),
  border = fp_border_default(width = 2)
)
ft
Set background color
Description
Change the background color of selected rows and columns of a flextable. A function can be used instead of fixed colors.
When bg is a function, it is possible to color cells based on values
located in other columns; using hidden columns (those not used by
argument colkeys) is a common use case. The argument source
must be used to define the columns to be used for the color
definition, and the argument j must be used to define where to apply
the colors and only accepts values from colkeys.
Usage
bg(x, i = NULL, j = NULL, bg, part = "body", source = j)
Arguments
x |
a 'flextable' object, see flextable-package to learn how to create 'flextable' object. |
i |
row selector, see section Row selection with the |
j |
column selector, see section Column selection with the |
bg |
color to use as background color. If a function, the function must return a character vector of colors. |
part |
part selector, see section Part selection with the |
source |
if bg is a function, source specifies the dataset column to be used
as an argument to |
Note
Word does not allow you to apply transparency to table cells or paragraph shading.
See Also
Other formatting shortcuts:
align(),
bold(),
color(),
empty_blanks(),
font(),
fontsize(),
highlight(),
indentation(),
italic(),
keep_with_next(),
line_spacing(),
padding(),
rotate(),
style(),
tab_settings(),
valign()
Examples
ft_1 <- flextable(head(mtcars))
ft_1 <- bg(ft_1, bg = "wheat", part = "header")
ft_1 <- bg(ft_1, i = ~ qsec < 18, bg = "#EFEFEF", part = "body")
ft_1 <- bg(ft_1, j = "drat", bg = "#606060", part = "all")
ft_1 <- color(ft_1, j = "drat", color = "white", part = "all")
ft_1

if (require("scales")) {
  ft_2 <- flextable(head(iris))
  colourer <- col_numeric(
    palette = c("wheat", "red"),
    domain = c(0, 7)
  )
  ft_2 <- bg(ft_2,
    j = c(
      "Sepal.Length", "Sepal.Width",
      "Petal.Length", "Petal.Width"
    ),
    bg = colourer, part = "body"
  )
  ft_2
}
Add flextable into a Word document
Description
Add a flextable into a Word document created with 'officer'.
Usage
body_add_flextable(
  x,
  value,
  align = NULL,
  pos = "after",
  split = NULL,
  topcaption = TRUE,
  keepnext = NULL
)
Arguments
x |
an rdocx object |
value |
|
align |
left, center (default) or right.
The |
pos |
where to add the flextable relative to the cursor, one of "after", "before", "on" (end of line). |
split |
set to TRUE if you want to activate Word
option 'Allow row to break across pages'.
This argument is still supported for the time being, but
we recommend using |
topcaption |
if TRUE caption is added before the table, if FALSE, caption is added after the table. |
keepnext |
Defunct in favor of |
Details
Use the paginate() function to define whether the table should
be displayed on one or more pages, and whether the header should be
displayed with the first lines of the table body on the same page.
Use the set_caption() function to define formatted captions
(with as_paragraph()) or simple captions (with a string).
topcaption can be used to insert the caption before the table
(default) or after the table (use FALSE).
See Also
knit_print.flextable(), save_as_docx()
Other functions for officer integration:
body_replace_flextable_at_bkm(),
ph_with.flextable(),
rtf_add.flextable()
Examples
library(officer)

# define global settings
set_flextable_defaults(
  split = TRUE,
  table_align = "center",
  table.layout = "autofit"
)

# produce 3 flextable
ft_1 <- flextable(head(airquality, n = 20))
ft_1 <- color(ft_1, i = ~ Temp > 70, color = "red", j = "Temp")
ft_1 <- highlight(ft_1, i = ~ Wind < 8, color = "yellow", j = "Wind")
ft_1 <- set_caption(
  x = ft_1,
  autonum = run_autonum(seq_id = "tab"),
  caption = "Daily air quality measurements"
)
ft_1 <- paginate(ft_1, init = TRUE, hdr_ftr = TRUE)

ft_2 <- proc_freq(mtcars, "vs", "gear")
ft_2 <- set_caption(
  x = ft_2,
  autonum = run_autonum(seq_id = "tab", bkm = "mtcars"),
  caption = as_paragraph(
    as_b("mtcars"), " ",
    colorize("table", color = "orange")
  ),
  fp_p = fp_par(keep_with_next = TRUE)
)
ft_2 <- paginate(ft_2, init = TRUE, hdr_ftr = TRUE)

ft_3 <- summarizor(iris, by = "Species")
ft_3 <- as_flextable(ft_3, spread_first_col = TRUE)
ft_3 <- set_caption(
  x = ft_3,
  autonum = run_autonum(seq_id = "tab"),
  caption = "iris summary"
)
ft_3 <- paginate(ft_3, init = TRUE, hdr_ftr = TRUE)

# add the 3 flextable in a new Word document
doc <- read_docx()
doc <- body_add_flextable(doc, value = ft_1)
doc <- body_add_par(doc, value = "")
doc <- body_add_flextable(doc, value = ft_2)
doc <- body_add_par(doc, value = "")
doc <- body_add_flextable(doc, value = ft_3)

fileout <- tempfile(fileext = ".docx")
print(doc, target = fileout)
Add flextable at bookmark location in a Word document
Description
Use this function if you want to replace a paragraph containing a bookmark with a flextable. As a side effect, the bookmark will be lost.
Usage
body_replace_flextable_at_bkm(
  x,
  bookmark,
  value,
  align = "center",
  split = FALSE
)
Arguments
x |
an rdocx object |
bookmark |
bookmark id |
value |
|
align |
left, center (default) or right. |
split |
set to TRUE if you want to activate Word option 'Allow row to break across pages'. |
See Also
Other functions for officer integration:
body_add_flextable(),
ph_with.flextable(),
rtf_add.flextable()
Set bold font
Description
Change the font weight of selected rows and columns of a flextable.
Usage
bold(x, i = NULL, j = NULL, bold = TRUE, part = "body")
Arguments
x |
a 'flextable' object, see flextable-package to learn how to create 'flextable' object. |
i |
row selector, see section Row selection with the |
j |
column selector, see section Column selection with the |
bold |
boolean value |
part |
part selector, see section Part selection with the |
See Also
Other formatting shortcuts:
align(),
bg(),
color(),
empty_blanks(),
font(),
fontsize(),
highlight(),
indentation(),
italic(),
keep_with_next(),
line_spacing(),
padding(),
rotate(),
style(),
tab_settings(),
valign()
Examples
ft <- flextable(head(iris))
ft <- bold(ft, bold = TRUE, part = "header")
Set cell borders
Description
change borders of selected rows and columns of a flextable. This function is not to be used by end user (it requires careful settings to avoid overlapping borders) but only for programming purposes.
If you need to add borders, use instead other functions:
These set borders for the whole table : border_outer(),
border_inner_h() and border_inner_v().
To add horizontal or vertical lines in the table at specific location, use:
To add following horizontal or vertical lines at beginning or end of the table, use:
-
hline_top(): set the top border (outer horizontal) -
hline_bottom(): set the bottom border (outer horizontal) -
vline_left(): set the left border (outer vertical) -
vline_right(): set the right border (outer vertical)
If you want to highlight specific cells with some borders, use
surround().
Usage
border(
  x,
  i = NULL,
  j = NULL,
  border = NULL,
  border.top = NULL,
  border.bottom = NULL,
  border.left = NULL,
  border.right = NULL,
  part = "body"
)
Arguments
x |
a 'flextable' object, see flextable-package to learn how to create 'flextable' object. |
i |
row selector, see section Row selection with the |
j |
column selector, see section Column selection with the |
border |
border (shortcut for top, bottom, left and right) |
border.top |
border top |
border.bottom |
border bottom |
border.left |
border left |
border.right |
border right |
part |
part selector, see section Part selection with the |
Note
pdf and pptx outputs do not support border() usage.
Examples
library(officer)
ftab <- flextable(head(mtcars))
ftab <- border(ftab, border.top = fp_border(color = "orange"))
ftab
Set all inner borders
Description
The function is applying a vertical and horizontal borders to inner content of one or all parts of a flextable.
Usage
border_inner(x, border = NULL, part = "all")
Arguments
x |
a 'flextable' object, see flextable-package to learn how to create 'flextable' object. |
border |
border properties defined by a call to |
part |
part selector, see section Part selection with the |
See Also
Other borders management:
border_inner_h(),
border_inner_v(),
border_outer(),
border_remove(),
hline(),
hline_bottom(),
hline_top(),
surround(),
vline(),
vline_left(),
vline_right()
Examples
library(officer)
std_border <- fp_border(color = "orange", width = 1)

dat <- iris[c(1:5, 51:55, 101:105), ]
ft <- flextable(dat)
ft <- border_remove(x = ft)

# add inner vertical borders
ft <- border_inner(ft, border = std_border)
ft
Set inner horizontal borders
Description
The function is applying a border to inner content of one or all parts of a flextable.
Usage
border_inner_h(x, border = NULL, part = "body")
Arguments
x |
a 'flextable' object, see flextable-package to learn how to create 'flextable' object. |
border |
border properties defined by a call to |
part |
part selector, see section Part selection with the |
See Also
Other borders management:
border_inner(),
border_inner_v(),
border_outer(),
border_remove(),
hline(),
hline_bottom(),
hline_top(),
surround(),
vline(),
vline_left(),
vline_right()
Examples
library(officer)
std_border <- fp_border(color = "orange", width = 1)

dat <- iris[c(1:5, 51:55, 101:105), ]
ft <- flextable(dat)
ft <- border_remove(x = ft)

# add inner horizontal borders
ft <- border_inner_h(ft, border = std_border)
ft
Set inner vertical borders
Description
The function is applying a vertical border to inner content of one or all parts of a flextable.
Usage
border_inner_v(x, border = NULL, part = "all")
Arguments
x |
a 'flextable' object, see flextable-package to learn how to create 'flextable' object. |
border |
border properties defined by a call to |
part |
part selector, see section Part selection with the |
See Also
Other borders management:
border_inner(),
border_inner_h(),
border_outer(),
border_remove(),
hline(),
hline_bottom(),
hline_top(),
surround(),
vline(),
vline_left(),
vline_right()
Examples
library(officer)
std_border <- fp_border(color = "orange", width = 1)

dat <- iris[c(1:5, 51:55, 101:105), ]
ft <- flextable(dat)
ft <- border_remove(x = ft)

# add inner vertical borders
ft <- border_inner_v(ft, border = std_border)
ft
Set outer borders
Description
The function is applying a border to outer cells of one or all parts of a flextable.
Usage
border_outer(x, border = NULL, part = "all")
Arguments
x |
a 'flextable' object, see flextable-package to learn how to create 'flextable' object. |
border |
border properties defined by a call to |
part |
part selector, see section Part selection with the |
See Also
Other borders management:
border_inner(),
border_inner_h(),
border_inner_v(),
border_remove(),
hline(),
hline_bottom(),
hline_top(),
surround(),
vline(),
vline_left(),
vline_right()
Examples
library(officer)
big_border <- fp_border(color = "red", width = 2)

dat <- iris[c(1:5, 51:55, 101:105), ]
ft <- flextable(dat)
ft <- border_remove(x = ft)

# add outer borders
ft <- border_outer(ft, part = "all", border = big_border)
ft
Remove borders
Description
The function is deleting all borders of the flextable object.
Usage
border_remove(x)
Arguments
x |
a 'flextable' object, see flextable-package to learn how to create 'flextable' object. |
See Also
Other borders management:
border_inner(),
border_inner_h(),
border_inner_v(),
border_outer(),
hline(),
hline_bottom(),
hline_top(),
surround(),
vline(),
vline_left(),
vline_right()
Examples
dat <- iris[c(1:5, 51:55, 101:105), ]
ft_1 <- flextable(dat)
ft_1 <- theme_box(ft_1)
ft_1

# remove all borders
ft_2 <- border_remove(x = ft_1)
ft_2
Create a chunk representation suitable for flextable
Description
This function is to be used by external packages that want to provide an object that can be inserted as a chunk object in paragraphs of a flextable object.
Usage
chunk_dataframe(...)
Arguments
... |
values to set. |
Value
a data.frame with an additional class "chunk" that makes it
suitable for beeing used in as_paragraph()
text pattern with default values
chunk_dataframe(txt = c("any text", "other text"))
text pattern with bold set to TRUE
chunk_dataframe(
  txt = c("any text", "other text"),
  bold = c(TRUE, TRUE))
text pattern with control over all formatting properties
chunk_dataframe(
  txt = c("any text", "other text"),
  font.size = c(12, 10),
  italic = c(FALSE, TRUE),
  bold = c(FALSE, TRUE),
  underlined = c(FALSE, TRUE),
  strike = c(FALSE, TRUE),
  color = c("black", "red"),
  shading.color = c("transparent", "yellow"),
  font.family = c("Arial", "Arial"),
  hansi.family = c("Arial", "Arial"),
  eastasia.family = c("Arial", "Arial"),
  cs.family = c("Arial", "Arial"),
  vertical.align = c("top", "bottom") )
text with url pattern
chunk_dataframe(
  txt = c("any text", "other text"),
  url = rep("https://www.google.fr", 2),
  font.size = c(12, 10),
  italic = c(FALSE, TRUE),
  bold = c(FALSE, TRUE),
  underlined = c(FALSE, TRUE),
  strike = c(FALSE, TRUE),
  color = c("black", "red"),
  shading.color = c("transparent", "yellow"),
  font.family = c("Arial", "Arial"),
  hansi.family = c("Arial", "Arial"),
  eastasia.family = c("Arial", "Arial"),
  cs.family = c("Arial", "Arial"),
  vertical.align = c("top", "bottom") )
images pattern
chunk_dataframe(width = width, height = height, img_data = files )
Format character cells
Description
Format character cells in a flextable.
Usage
colformat_char(
  x,
  i = NULL,
  j = NULL,
  na_str = get_flextable_defaults()$na_str,
  nan_str = get_flextable_defaults()$nan_str,
  prefix = "",
  suffix = ""
)
Arguments
x |
a 'flextable' object, see flextable-package to learn how to create 'flextable' object. |
i |
row selector, see section Row selection with the |
j |
column selector, see section Column selection with the |
na_str, nan_str |
string to be used for NA and NaN values |
prefix, suffix |
string to be used as prefix or suffix |
See Also
Other cells formatters:
colformat_date(),
colformat_datetime(),
colformat_double(),
colformat_image(),
colformat_int(),
colformat_lgl(),
colformat_num(),
set_formatter()
Examples
dat <- iris
z <- flextable(head(dat))
ft <- colformat_char(
  x = z, j = "Species", suffix = "!"
)
z <- autofit(z)
z
Format date cells
Description
Format date cells in a flextable.
Usage
colformat_date(
  x,
  i = NULL,
  j = NULL,
  fmt_date = get_flextable_defaults()$fmt_date,
  na_str = get_flextable_defaults()$na_str,
  nan_str = get_flextable_defaults()$nan_str,
  prefix = "",
  suffix = ""
)
Arguments
x |
a 'flextable' object, see flextable-package to learn how to create 'flextable' object. |
i |
row selector, see section Row selection with the |
j |
column selector, see section Column selection with the |
fmt_date |
see |
na_str, nan_str |
string to be used for NA and NaN values |
prefix, suffix |
string to be used as prefix or suffix |
See Also
Other cells formatters:
colformat_char(),
colformat_datetime(),
colformat_double(),
colformat_image(),
colformat_int(),
colformat_lgl(),
colformat_num(),
set_formatter()
Examples
dat <- data.frame(
  z = Sys.Date() + 1:3,
  w = Sys.Date() - 1:3
)
ft <- flextable(dat)
ft <- colformat_date(x = ft)
ft <- autofit(ft)
ft
Format datetime cells
Description
Format datetime cells in a flextable.
Usage
colformat_datetime(
  x,
  i = NULL,
  j = NULL,
  fmt_datetime = get_flextable_defaults()$fmt_datetime,
  na_str = get_flextable_defaults()$na_str,
  nan_str = get_flextable_defaults()$nan_str,
  prefix = "",
  suffix = ""
)
Arguments
x |
a 'flextable' object, see flextable-package to learn how to create 'flextable' object. |
i |
row selector, see section Row selection with the |
j |
column selector, see section Column selection with the |
fmt_datetime |
see |
na_str, nan_str |
string to be used for NA and NaN values |
prefix, suffix |
string to be used as prefix or suffix |
See Also
Other cells formatters:
colformat_char(),
colformat_date(),
colformat_double(),
colformat_image(),
colformat_int(),
colformat_lgl(),
colformat_num(),
set_formatter()
Examples
dat <- data.frame(
  z = Sys.time() + (1:3) * 24,
  w = Sys.Date() - (1:3) * 24
)
ft <- flextable(dat)
ft <- colformat_datetime(x = ft)
ft <- autofit(ft)
ft
Format double cells
Description
Format numeric cells in a flextable using
formatC() with explicit control over digits and
decimal mark.
Usage
colformat_double(
  x,
  i = NULL,
  j = NULL,
  big.mark = get_flextable_defaults()$big.mark,
  decimal.mark = get_flextable_defaults()$decimal.mark,
  digits = get_flextable_defaults()$digits,
  na_str = get_flextable_defaults()$na_str,
  nan_str = get_flextable_defaults()$nan_str,
  prefix = "",
  suffix = ""
)
Arguments
x |
a 'flextable' object, see flextable-package to learn how to create 'flextable' object. |
i |
row selector, see section Row selection with the |
j |
column selector, see section Column selection with the |
big.mark, digits, decimal.mark |
see |
na_str, nan_str |
string to be used for NA and NaN values |
prefix, suffix |
string to be used as prefix or suffix |
See Also
Other cells formatters:
colformat_char(),
colformat_date(),
colformat_datetime(),
colformat_image(),
colformat_int(),
colformat_lgl(),
colformat_num(),
set_formatter()
Examples
dat <- mtcars
ft <- flextable(head(dat))
ft <- colformat_double(
  x = ft,
  big.mark = ",", digits = 2, na_str = "N/A"
)
autofit(ft)
Format cells as images
Description
Format image paths as images in a flextable.
Usage
colformat_image(
  x,
  i = NULL,
  j = NULL,
  width,
  height,
  na_str = get_flextable_defaults()$na_str,
  nan_str = get_flextable_defaults()$nan_str,
  prefix = "",
  suffix = "",
  alt = ""
)
Arguments
x |
a 'flextable' object, see flextable-package to learn how to create 'flextable' object. |
i |
row selector, see section Row selection with the |
j |
column selector, see section Column selection with the |
width, height |
size of the png file in inches |
na_str, nan_str |
string to be used for NA and NaN values |
prefix, suffix |
string to be used as prefix or suffix |
alt |
alternative text for the images (used for accessibility) |
See Also
Other cells formatters:
colformat_char(),
colformat_date(),
colformat_datetime(),
colformat_double(),
colformat_int(),
colformat_lgl(),
colformat_num(),
set_formatter()
Examples
img.file <- file.path(R.home("doc"), "html", "logo.jpg")

dat <- head(iris)
dat$Species <- as.character(dat$Species)
dat[c(1, 3, 5), "Species"] <- img.file

myft <- flextable(dat)
myft <- colformat_image(
  myft,
  i = c(1, 3, 5),
  j = "Species", width = .20, height = .15
)
ft <- autofit(myft)
ft
Format integer cells
Description
Format integer cells in a flextable.
Usage
colformat_int(
  x,
  i = NULL,
  j = NULL,
  big.mark = get_flextable_defaults()$big.mark,
  na_str = get_flextable_defaults()$na_str,
  nan_str = get_flextable_defaults()$nan_str,
  prefix = "",
  suffix = ""
)
Arguments
x |
a 'flextable' object, see flextable-package to learn how to create 'flextable' object. |
i |
row selector, see section Row selection with the |
j |
column selector, see section Column selection with the |
big.mark |
see |
na_str, nan_str |
string to be used for NA and NaN values |
prefix, suffix |
string to be used as prefix or suffix |
See Also
Other cells formatters:
colformat_char(),
colformat_date(),
colformat_datetime(),
colformat_double(),
colformat_image(),
colformat_lgl(),
colformat_num(),
set_formatter()
Examples
z <- flextable(head(mtcars))
j <- c("vs", "am", "gear", "carb")
z <- colformat_int(x = z, j = j, prefix = "# ")
z
Format logical cells
Description
Format logical cells in a flextable.
Usage
colformat_lgl(
  x,
  i = NULL,
  j = NULL,
  true = "true",
  false = "false",
  na_str = get_flextable_defaults()$na_str,
  nan_str = get_flextable_defaults()$nan_str,
  prefix = "",
  suffix = ""
)
Arguments
x |
a 'flextable' object, see flextable-package to learn how to create 'flextable' object. |
i |
row selector, see section Row selection with the |
j |
column selector, see section Column selection with the |
false, true |
string to be used for logical |
na_str, nan_str |
string to be used for NA and NaN values |
prefix, suffix |
string to be used as prefix or suffix |
See Also
Other cells formatters:
colformat_char(),
colformat_date(),
colformat_datetime(),
colformat_double(),
colformat_image(),
colformat_int(),
colformat_num(),
set_formatter()
Examples
dat <- data.frame(a = c(TRUE, FALSE), b = c(FALSE, TRUE))

z <- flextable(dat)
z <- colformat_lgl(x = z, j = c("a", "b"))
autofit(z)
Format numeric cells with format()
Description
Format numeric cells in a flextable
using R's format() function.
The function is different from colformat_double() on numeric type
columns. The function uses the format() function of R on numeric
type columns. So this is normally what you see on the R console
most of the time (but scientific mode is disabled and NA are replaced).
Usage
colformat_num(
  x,
  i = NULL,
  j = NULL,
  big.mark = get_flextable_defaults()$big.mark,
  decimal.mark = get_flextable_defaults()$decimal.mark,
  na_str = get_flextable_defaults()$na_str,
  nan_str = get_flextable_defaults()$nan_str,
  prefix = "",
  suffix = "",
  ...
)
Arguments
x |
a 'flextable' object, see flextable-package to learn how to create 'flextable' object. |
i |
row selector, see section Row selection with the |
j |
column selector, see section Column selection with the |
big.mark, decimal.mark |
see |
na_str, nan_str |
string to be used for NA and NaN values |
prefix, suffix |
string to be used as prefix or suffix |
... |
additional argument for function |
format call
Function format() is called with the following values:
-
trimis set to TRUE, -
scientificis set to FALSE, -
big.markis set to the value ofbig.markargument, -
decimal.markis set to the value ofdecimal.markargument, other arguments are passed 'as is' to the format function.
argument digits is ignored as it is not the same digits that users
want, this one will be used by format() and not formatC().
To change the digit argument use options(digits=4) instead.
This argument will not be changed because colformat_num()
is supposed to format things roughly as what you see on the R console.
If these functions does not fit your needs, use set_formatter()
that lets you use any format function.
See Also
Other cells formatters:
colformat_char(),
colformat_date(),
colformat_datetime(),
colformat_double(),
colformat_image(),
colformat_int(),
colformat_lgl(),
set_formatter()
Examples
dat <- mtcars
dat[2, 1] <- NA
ft <- flextable(head(dat))
ft <- colformat_num(
  x = ft,
  big.mark = " ", decimal.mark = ",",
  na_str = "N/A"
)
ft <- autofit(ft)
ft
Set font color
Description
Change the text color of selected rows and columns of a flextable. A function can be used instead of fixed colors.
When color is a function, it is possible to color cells based on values
located in other columns; using hidden columns (those not used by
argument colkeys) is a common use case. The argument source
must be used to define the columns to be used for the color
definition, and the argument j must be used to define where to apply
the colors and only accepts values from colkeys.
Usage
color(x, i = NULL, j = NULL, color, part = "body", source = j)
Arguments
x |
a 'flextable' object, see flextable-package to learn how to create 'flextable' object. |
i |
row selector, see section Row selection with the |
j |
column selector, see section Column selection with the |
color |
color to use as font color. If a function, the function must return a character vector of colors. |
part |
part selector, see section Part selection with the |
source |
if color is a function, source specifies the dataset column to be used
as an argument to |
See Also
Other formatting shortcuts:
align(),
bg(),
bold(),
empty_blanks(),
font(),
fontsize(),
highlight(),
indentation(),
italic(),
keep_with_next(),
line_spacing(),
padding(),
rotate(),
style(),
tab_settings(),
valign()
Examples
ft <- flextable(head(mtcars))
ft <- color(ft, color = "orange", part = "header")
ft <- color(ft,
  color = "red",
  i = ~ qsec < 18 & vs < 1
)
ft

if (require("scales")) {
  scale <- scales::col_numeric(domain = c(-1, 1), palette = "RdBu")
  x <- as.data.frame(cor(iris[-5]))
  x <- cbind(
    data.frame(
      colname = colnames(x),
      stringsAsFactors = FALSE
    ),
    x
  )
}
Colorize chunk
Description
The function is producing a chunk with a font in color.
It is used to add it to the content of a cell of the
flextable with the functions compose(), append_chunks()
or prepend_chunks().
Usage
colorize(x, color)
Arguments
x |
value, if a chunk, the chunk will be updated |
color |
color to use as text highlighting color as character vector. |
See Also
Other chunk elements for paragraph:
as_b(),
as_bracket(),
as_chunk(),
as_equation(),
as_highlight(),
as_i(),
as_image(),
as_qmd(),
as_strike(),
as_sub(),
as_sup(),
as_word_field(),
gg_chunk(),
grid_chunk(),
hyperlink_text(),
linerange(),
minibar(),
plot_chunk()
Examples
ft <- flextable(head(iris),
  col_keys = c("Sepal.Length", "dummy")
)

ft <- compose(ft,
  j = "dummy",
  value = as_paragraph(colorize(Sepal.Length, color = "red"))
)

ft
Compact Summary of a Dataset
Description
Produces a compact summary of a data.frame. Each row of the result describes one column of the input with a type-specific synopsis.
Supported types and their summaries:
-
numeric / integer: count of non-
NAvalues, min and max. -
character: number of unique values, first values listed.
-
factor: number of levels, levels listed.
-
logical: count of non-
NAvalues, counts ofTRUEandFALSE. -
Date: count of non-
NAvalues, date range. -
POSIXct / POSIXlt: count of non-
NAvalues, datetime range. -
hms / difftime: count of non-
NAvalues, time range.
Character and factor columns share the same summary layout but report a different type label.
The result has class "compact_summary" and can be converted
into a flextable with as_flextable().
Usage
compact_summary(x, show_type = FALSE, show_na = FALSE, max_levels = 10L)
Arguments
x |
A data.frame. |
show_type |
If |
show_na |
If |
max_levels |
Maximum number of levels or unique values
displayed for factor and character columns. Additional
values are replaced by |
Value
A data.frame with additional class "compact_summary".
See Also
as_flextable.compact_summary()
Other as_flextable methods:
as_flextable.compact_summary(),
as_flextable.data.frame(),
as_flextable.gam(),
as_flextable.glm(),
as_flextable.grouped_data(),
as_flextable.htest(),
as_flextable.kmeans(),
as_flextable.lm(),
as_flextable.merMod(),
as_flextable.pam(),
as_flextable.summarizor(),
as_flextable.table(),
as_flextable.tabular(),
as_flextable.tabulator(),
as_flextable.xtable()
Examples
z <- compact_summary(iris)
as_flextable(z)

z <- compact_summary(iris, show_type = TRUE, show_na = TRUE)
as_flextable(z)
Set cell content from paragraph chunks
Description
Modify flextable displayed values with eventually mixed content paragraphs.
Function is handling complex formatting as image insertion with
as_image(), superscript with as_sup(), formated
text with as_chunk() and several other chunk functions.
Function mk_par is another name for compose as
there is an unwanted conflict with package 'purrr'.
If you only need to add some content at the end
or the beginning of paragraphs and keep existing
content as it is, functions append_chunks() and
prepend_chunks() should be prefered.
Usage
compose(x, i = NULL, j = NULL, value, part = "body", use_dot = FALSE)

mk_par(x, i = NULL, j = NULL, value, part = "body", use_dot = FALSE)
Arguments
x |
a 'flextable' object, see flextable-package to learn how to create 'flextable' object. |
i |
row selector, see section Row selection with the |
j |
column selector, see section Column selection with the |
value |
a call to function |
part |
part selector, see section Part selection with the |
use_dot |
by default |
See Also
fp_text_default(), as_chunk(), as_b(), as_word_field(), labelizor()
Other functions to compose cell content:
append_chunks(),
as_paragraph(),
footnote(),
labelizor(),
prepend_chunks(),
void()
Examples
ft_1 <- flextable(head(cars, n = 5), col_keys = c("speed", "dist", "comment"))
ft_1 <- mk_par(
  x = ft_1, j = "comment",
  i = ~ dist > 9,
  value = as_paragraph(
    colorize(as_i("speed: "), color = "gray"),
    as_sup(sprintf("%.0f", speed))
  )
)
ft_1 <- set_table_properties(ft_1, layout = "autofit")
ft_1

# using `use_dot = TRUE` ----
set.seed(8)
dat <- iris[sample.int(n = 150, size = 10), ]
dat <- dat[order(dat$Species), ]


ft_2 <- flextable(dat)
ft_2 <- mk_par(ft_2,
  j = ~ . - Species,
  value = as_paragraph(
    minibar(.,
      barcol = "white",
      height = .1
    )
  ), use_dot = TRUE
)
ft_2 <- theme_vader(ft_2)
ft_2 <- autofit(ft_2)
ft_2
Summarize continuous variables as a flextable
Description
create a data.frame summary for continuous variables
Usage
continuous_summary(
  dat,
  columns = NULL,
  by = character(0),
  hide_grouplabel = TRUE,
  digits = 3
)
Arguments
dat |
a data.frame |
columns |
continuous variables to be summarized. If NULL all continuous variables are summarized. |
by |
discrete variables to use as groups when summarizing. |
hide_grouplabel |
if TRUE, group label will not be rendered, only level/value will be rendered. |
digits |
the desired number of digits after the decimal point |
Examples
ft_1 <- continuous_summary(iris, names(iris)[1:4],
  by = "Species",
  hide_grouplabel = FALSE
)
ft_1
Delete flextable columns
Description
The function removes one or more columns from a 'flextable'.
Usage
delete_columns(x, j = NULL)
Arguments
x |
a 'flextable' object, see flextable-package to learn how to create 'flextable' object. |
j |
column selector, see section Column selection with the |
Details
Deleting one or more columns will result in the deletion of any span parameters that may have been set previously. They will have to be redone after this operation or performed only after this deletion.
See Also
Other row and column operations:
add_body(),
add_body_row(),
add_footer(),
add_footer_lines(),
add_footer_row(),
add_header(),
add_header_lines(),
add_header_row(),
delete_part(),
delete_rows(),
paginate(),
separate_header(),
set_header_footer_df,
set_header_labels(),
split_columns(),
split_rows(),
split_to_pages()
Examples
ft <- flextable(head(iris))
ft <- delete_columns(ft, j = "Species")
ft
Delete flextable part
Description
indicate to not print a part of the flextable, i.e. an header, footer or the body.
Usage
delete_part(x, part = "header")
Arguments
x |
a 'flextable' object, see flextable-package to learn how to create 'flextable' object. |
part |
part selector, see section Part selection with the |
See Also
Other row and column operations:
add_body(),
add_body_row(),
add_footer(),
add_footer_lines(),
add_footer_row(),
add_header(),
add_header_lines(),
add_header_row(),
delete_columns(),
delete_rows(),
paginate(),
separate_header(),
set_header_footer_df,
set_header_labels(),
split_columns(),
split_rows(),
split_to_pages()
Examples
ft <- flextable(head(iris))
ft <- delete_part(x = ft, part = "header")
ft
Delete flextable rows
Description
The function removes one or more rows from a 'flextable'.
Usage
delete_rows(x, i = NULL, part = "body")
Arguments
x |
a 'flextable' object, see flextable-package to learn how to create 'flextable' object. |
i |
row selector, see section Row selection with the |
part |
part selector, see section Part selection with the |
Details
Deleting one or more rows will result in the deletion of any span parameters that may have been set previously. They will have to be redone after this operation or performed only after this deletion.
See Also
Other row and column operations:
add_body(),
add_body_row(),
add_footer(),
add_footer_lines(),
add_footer_row(),
add_header(),
add_header_lines(),
add_header_row(),
delete_columns(),
delete_part(),
paginate(),
separate_header(),
set_header_footer_df,
set_header_labels(),
split_columns(),
split_rows(),
split_to_pages()
Examples
ft <- flextable(head(iris))
ft <- delete_rows(ft, i = 1:5, part = "body")
ft
data.frame automatic printing as a flextable
Description
Create a summary from a data.frame as a flextable. This function is to be used in an R Markdown document.
To use that function, you must declare it in the part df_print of the 'YAML'
header of your R Markdown document:
---
df_print: !expr function(x) flextable::df_printer(x)
---
We notice an unexpected behavior with bookdown. When using bookdown it
is necessary to use use_df_printer() instead in a setup run chunk:
use_df_printer()
Usage
df_printer(dat, ...)
Arguments
dat |
the data.frame |
... |
unused argument |
Details
'knitr' chunk options are available to customize the output:
-
ft_max_row: The number of rows to print. Default to 10. -
ft_split_colnames: Should the column names be split (with non alpha-numeric characters). Default to FALSE. -
ft_short_strings: Should the character column be shorten. Default to FALSE. -
ft_short_size: Maximum length of character column ifft_short_stringsis TRUE. Default to 35. -
ft_short_suffix: Suffix to add when character values are shorten. Default to "...". -
ft_do_autofit: Use autofit() before rendering the table. Default to TRUE. -
ft_show_coltype: Show column types. Default to TRUE. -
ft_color_coltype: Color to use for column types. Default to "#999999".
See Also
Other functions for flextable output and export:
flextable_to_rmd(),
gen_grob(),
htmltools_value(),
knit_print.flextable(),
plot.flextable(),
print.flextable(),
repair_docx(),
save_as_docx(),
save_as_html(),
save_as_image(),
save_as_pptx(),
save_as_rtf(),
to_html.flextable(),
wrap_flextable()
Examples
df_printer(head(mtcars))
Get column widths and row heights of a flextable
Description
returns widths and heights for each table columns and rows. Values are expressed in inches.
Usage
## S3 method for class 'flextable'
dim(x)
Arguments
x |
a 'flextable' object, see flextable-package to learn how to create 'flextable' object. |
See Also
Other functions for flextable size management:
autofit(),
dim_pretty(),
fit_columns(),
fit_to_width(),
flextable_dim(),
height(),
hrule(),
ncol_keys(),
nrow_part(),
set_table_properties(),
width()
Examples
ftab <- flextable(head(iris))
dim(ftab)
Get optimal width and height of a flextable grob
Description
returns the optimal width and height for the grob, according to the grob generation parameters.
Usage
## S3 method for class 'flextableGrob'
dim(x)
Arguments
x |
a flextableGrob object |
Value
a named list with two elements, width and height.
Values are expressed in inches.
Examples
ftab <- flextable(head(iris))
gr <- gen_grob(ftab)
dim(gr)
Calculate optimal column widths and row heights
Description
return minimum estimated widths and heights for each table columns and rows in inches.
Usage
dim_pretty(x, part = "all", unit = "in", hspans = "none")
Arguments
x |
a 'flextable' object, see flextable-package to learn how to create 'flextable' object. |
part |
part selector, see section Part selection with the |
unit |
unit for returned values, one of "in", "cm", "mm". |
hspans |
specifies how cells that are horizontally are included in the calculation. It must be one of the following values "none", "divided" or "included". If "none", widths of horizontally spanned cells is set to 0 (then do not affect the widths); if "divided", widths of horizontally spanned cells is divided by the number of spanned cells; if "included", all widths (included horizontally spanned cells) will be used in the calculation. |
See Also
Other functions for flextable size management:
autofit(),
dim.flextable(),
fit_columns(),
fit_to_width(),
flextable_dim(),
height(),
hrule(),
ncol_keys(),
nrow_part(),
set_table_properties(),
width()
Examples
ftab <- flextable(head(mtcars))
dim_pretty(ftab)
Make blank columns transparent
Description
Blank columns are set as transparent. This is a shortcut function that deletes top and bottom borders, changes the background color to transparent, displays empty content, and sets blank column widths.
Usage
empty_blanks(x, width = 0.05, unit = "in", part = "all")
Arguments
x |
a 'flextable' object, see flextable-package to learn how to create 'flextable' object. |
width |
width of blank columns (.1 inch by default). |
unit |
unit for width, one of "in", "cm", "mm". |
part |
part selector, see section Part selection with the |
See Also
Other formatting shortcuts:
align(),
bg(),
bold(),
color(),
font(),
fontsize(),
highlight(),
indentation(),
italic(),
keep_with_next(),
line_spacing(),
padding(),
rotate(),
style(),
tab_settings(),
valign()
Examples
typology <- data.frame(
  col_keys = c(
    "Sepal.Length", "Sepal.Width", "Petal.Length",
    "Petal.Width", "Species"
  ),
  what = c("Sepal", "Sepal", "Petal", "Petal", " "),
  measure = c("Length", "Width", "Length", "Width", "Species"),
  stringsAsFactors = FALSE
)
typology

ftab <- flextable(head(iris), col_keys = c(
  "Species",
  "break1", "Sepal.Length", "Sepal.Width",
  "break2", "Petal.Length", "Petal.Width"
))
ftab <- set_header_df(ftab, mapping = typology, key = "col_keys")
ftab <- merge_h(ftab, part = "header")
ftab <- theme_vanilla(ftab)
ftab <- empty_blanks(ftab)
ftab <- width(ftab, j = c(2, 5), width = .1)
ftab
Constrain table width by wrapping text
Description
Shrink column widths so that the total table width
does not exceed max_width. Font sizes are unchanged; text wraps
inside the narrower cells.
Columns that cannot shrink below their longest word (plus padding) are clamped at that floor; remaining space is iteratively redistributed among unclamped columns.
Columns listed in no_wrap keep their optimal width (as computed
by dim_pretty()) and are not compressed.
To constrain width by reducing font size instead, see
fit_to_width(). To size columns to their content without a
width constraint, see autofit().
Usage
fit_columns(x, max_width, no_wrap = NULL, unit = "in")
Arguments
x |
a 'flextable' object, see flextable-package to learn how to create 'flextable' object. |
max_width |
maximum total table width (in inches by default) |
no_wrap |
column names or indices that must keep their optimal width (no compression, no text wrapping). |
unit |
unit for |
See Also
Other functions for flextable size management:
autofit(),
dim.flextable(),
dim_pretty(),
fit_to_width(),
flextable_dim(),
height(),
hrule(),
ncol_keys(),
nrow_part(),
set_table_properties(),
width()
Examples
ft <- qflextable(head(mtcars))
ft <- fit_columns(ft, max_width = 5)
flextable_dim(ft)$widths
ft
Constrain table width by shrinking font size
Description
Decrease font size incrementally until the table fits
within max_width.
To constrain width by wrapping text instead, see fit_columns().
To size columns to their content without a width constraint,
see autofit().
Usage
fit_to_width(x, max_width, inc = 1L, max_iter = 20, unit = "in")
Arguments
x |
a 'flextable' object, see flextable-package to learn how to create 'flextable' object. |
max_width |
maximum width to fit in inches |
inc |
the font size decrease for each step |
max_iter |
maximum iterations |
unit |
unit for max_width, one of "in", "cm", "mm". |
See Also
Other functions for flextable size management:
autofit(),
dim.flextable(),
dim_pretty(),
fit_columns(),
flextable_dim(),
height(),
hrule(),
ncol_keys(),
nrow_part(),
set_table_properties(),
width()
Examples
ft_1 <- qflextable(head(mtcars))
ft_1 <- width(ft_1, width = 1)
ft_1

ft_2 <- fit_to_width(ft_1, max_width = 4)
ft_2
Fix border issues when cells are merged
Description
When cells are merged, the rendered borders will be those of the first cell. If a column is made of three merged cells, the bottom border that will be seen will be the bottom border of the first cell in the column. From a user point of view, this is wrong, the bottom should be the one defined for cell 3. This function modify the border values to avoid that effect.
Note since version 0.9.7 that the function is called automatically
before rendering, user should not have to call this function anymore.
Usage
fix_border_issues(x, part = "all")
Arguments
x |
a 'flextable' object, see flextable-package to learn how to create 'flextable' object. |
part |
part selector, see section Part selection with the |
Examples
library(officer)
dat <- data.frame(a = 1:5, b = 6:10)
ft <- flextable(dat)
ft <- theme_box(ft)
ft <- merge_at(ft, i = 4:5, j = 1, part = "body")
ft <- hline(ft,
  i = 5, part = "body",
  border = fp_border(color = "red", width = 5)
)
print(ft)
ft <- fix_border_issues(ft)
print(ft)
Create a flextable from a data frame
Description
Create a flextable object with function flextable.
flextable are designed to make tabular reporting easier for
R users. Functions are available to let you format text, paragraphs and cells;
table cells can be merge vertically or horizontally, row headers can easily
be defined, rows heights and columns widths can be manually set or automatically
computed.
If working with 'R Markdown' documents, you should read about knitr
chunk options in knit_print.flextable() and about setting
default values with set_flextable_defaults().
Usage
flextable(
  data,
  col_keys = names(data),
  cwidth = 0.75,
  cheight = 0.25,
  defaults = list(),
  theme_fun = theme_booktabs,
  use_labels = TRUE
)

qflextable(data)
Arguments
data |
dataset |
col_keys |
columns names/keys to display. If some column names are not in the dataset, they will be added as blank columns by default. |
cwidth, cheight |
initial width and height to use for cell sizes in inches. |
defaults, theme_fun |
deprecated, use |
use_labels |
Logical; if TRUE, any column labels or value labels present in the dataset will be used for display purposes. Defaults to TRUE. |
Reuse frequently used parameters
Some default formatting properties are automatically applied to every flextable you produce.
It is highly recommended to use this function because
its use will minimize the code. For example, instead of
calling the fontsize() function over and over again for
each new flextable, set the font size default value by
calling (before creating the flextables)
set_flextable_defaults(font.size = 11). This is also
a simple way to have homogeneous arrays and make the
documents containing them easier to read.
You can change these default values with function
set_flextable_defaults(). You can reset them
with function init_flextable_defaults(). You
can access these values by calling get_flextable_defaults().
new lines and tabulations
The 'flextable' package will translate for you
the new lines expressed in the form \n and
the tabs expressed in the form \t.
The new lines will be transformed into "soft-return", that is to say a simple carriage return and not a new paragraph.
Tabs are different depending on the output format:
HTML is using entity em space
Word - a Word 'tab' element
PowerPoint - a PowerPoint 'tab' element
latex - tag "\quad "
Typst - horizontal space
#h(1em)
flextable parts
A flextable is made of 3 parts: header, body and footer.
Most functions have an argument named part that will be used
to specify what part of of the table should be modified.
qflextable
qflextable is a convenient tool to produce quickly
a flextable for reporting where layout is fixed (see
set_table_properties()) and columns
widths are adjusted with autofit().
See Also
style(), autofit(), theme_booktabs(), knit_print.flextable(),
compose(), footnote(), set_caption()
Other flextable constructors:
as_flextable()
Examples
ft <- flextable(head(mtcars))
ft
Get overall width and height of a flextable
Description
Returns the width, height and
aspect ratio of a flextable in a named list.
The aspect ratio is the ratio corresponding to height/width.
Names of the list are widths, heights and aspect_ratio.
Usage
flextable_dim(x, unit = "in")
Arguments
x |
a 'flextable' object, see flextable-package to learn how to create 'flextable' object. |
unit |
unit for returned values, one of "in", "cm", "mm". |
See Also
Other functions for flextable size management:
autofit(),
dim.flextable(),
dim_pretty(),
fit_columns(),
fit_to_width(),
height(),
hrule(),
ncol_keys(),
nrow_part(),
set_table_properties(),
width()
Examples
ftab <- flextable(head(iris))
flextable_dim(ftab)
ftab <- autofit(ftab)
flextable_dim(ftab)
htmlDependency for flextable objects
Description
When using loops in an R Markdown for HTML document, the htmlDependency object for flextable must also be added at least once.
Usage
flextable_html_dependency()
Examples
if (require("htmltools")) {
  div(flextable_html_dependency())
}
Selectors in flextable
Description
Selectors are a core feature of flextable that allow you to specify which
parts (part), rows (i) and columns (j) should be affected by formatting,
styling, or content operations.
Many flextable functions support these selectors, including bg(),
bold(), color(), padding(), fontsize(), italic(), align(),
mk_par(), hline(), vline(), and many others.
Selectors make conditional formatting easy and enable seamless piping of
multiple operations using %>% or |>.
Row selection with the i parameter
The i parameter is used to select specific rows in a flextable for
formatting, styling, or content operations.
When i = NULL (the default), operations apply to all rows.
i = ~ condition           # Formula (body only)
i = 1:5                   # Integer vector
i = c(TRUE, FALSE, ...)   # Logical vector
i = NULL                  # All rows (default)
Best practices:
Use formulas (
i = ~ condition) for conditional selection in bodyUse integers for positional selection in any part.
Use
nrow_part()for dynamic row selection
Column selection with the j parameter
The j parameter is used to select specific columns in a flextable for
formatting, styling, or content operations.
When j = NULL (the default), operations apply to all columns.
j = ~ col1 + col2         # Formula (select multiple)
j = ~ . - col1            # Formula (exclude columns)
j = c("col1", "col2")     # Character vector (recommended)
j = 1:5                   # Integer vector
j = c(TRUE, FALSE, ...)   # Logical vector
j = NULL                  # All columns (default)
Best practices:
Use character vectors (
j = c("col1", "col2")) for clarity and maintainability.Use formulas (
j = ~ col1 + col2) for excluding columns.Avoid integer positions when possible (less maintainable).
Column selectors work with all parts (header, body, footer, all).
Part selection with the part parameter
The part parameter specifies which section of the flextable should be
affected by formatting, styling, or content operations.
part = "body"    # Data rows (default)
part = "header"  # Header rows
part = "footer"  # Footer rows
part = "all"     # All parts
When
part = "body"(the default), operations apply only to the data rows.When
part = "all", the operation is applied to each part independently.
Formula row selectors (i = ~ condition) CANNOT be used with:
-
part = "header"- Headers contain only character values -
part = "footer"- Footers contain only character values -
part = "all"- Header/footer are character-only while body has original data types
This restriction exists because formula selectors evaluate conditions using
the actual data types from your dataset (numeric, logical, etc.). Headers and
footers store only character representations of values, so conditional
expressions like i = ~ price < 330 cannot be evaluated on them.
Advanced Programming with Selectors
Function nrow_part() returns the number of lines in a part.
# Format the last row differently
ft <- flextable(iris[48:52,])
ft <- bold(ft, i = nrow_part(ft, part = "body"))

# Add footnote to last row
ft <- footnote(
  ft,
  i = nrow_part(ft, part = "body"), j = 1:4,
  value = as_paragraph("Calculated mean")
)
ft
Function ncol_keys() returns the number of columns.
# Get column count
ncol_keys(ft)

# Useful for programmatic selection
ncols <- ncol_keys(ft)
ft <- bg(ft, j = rep(c(TRUE, FALSE), length.out = ncols), bg = "#f0f0f0")
ft
Print a flextable inside knitr loops and conditionals
Description
Print flextable in R Markdown or Quarto documents
within for loop or if statement.
The function is particularly useful when you want to generate flextable in a loop from a R Markdown document.
Inside R Markdown document, chunk option results must be
set to 'asis'.
See knit_print.flextable for more details.
Usage
flextable_to_rmd(x, ...)
Arguments
x |
a 'flextable' object, see flextable-package to learn how to create 'flextable' object. |
... |
unused argument |
See Also
Other functions for flextable output and export:
df_printer(),
gen_grob(),
htmltools_value(),
knit_print.flextable(),
plot.flextable(),
print.flextable(),
repair_docx(),
save_as_docx(),
save_as_html(),
save_as_image(),
save_as_pptx(),
save_as_rtf(),
to_html.flextable(),
wrap_flextable()
Examples
## Not run:
library(rmarkdown)
if (pandoc_available() &&
  pandoc_version() > numeric_version("2")) {
  demo_loop <- system.file(
    package = "flextable",
    "examples/rmd",
    "loop_with_flextable.Rmd"
  )
  rmd_file <- tempfile(fileext = ".Rmd")
  file.copy(demo_loop, to = rmd_file, overwrite = TRUE)
  render(
    input = rmd_file, output_format = "html_document",
    output_file = "loop_with_flextable.html"
  )
}

## End(Not run)
Format summarizor statistics as text
Description
Format the output of summarizor() into display strings:
quantitative variables are shown as mean (sd), median (IQR), or range;
qualitative variables are shown as count (percentage).
Usage
fmt_2stats(stat, num1, num2, cts, pcts, ...)

fmt_summarizor(stat, num1, num2, cts, pcts, ...)
Arguments
stat |
a character column containing the name of statictics |
num1 |
a numeric statistic to display such as a mean or a median |
num2 |
a numeric statistic to display such as a standard deviation or a median absolute deviation. |
cts |
a count to display |
pcts |
a percentage to display |
... |
unused arguments |
See Also
summarizor(), tabulator(), mk_par()
Other value formatters:
fmt_avg_dev(),
fmt_dbl(),
fmt_header_n(),
fmt_int(),
fmt_n_percent(),
fmt_pct(),
fmt_signif_after_zeros()
Examples
library(flextable)
z <- summarizor(iris, by = "Species")

tab_1 <- tabulator(
  x = z,
  rows = c("variable", "stat"),
  columns = "Species",
  blah = as_paragraph(
    as_chunk(
      fmt_summarizor(
        stat = stat,
        num1 = value1, num2 = value2,
        cts = cts, pcts = percent
      )
    )
  )
)

ft_1 <- as_flextable(x = tab_1, separate_with = "variable")
ft_1 <- labelizor(
  x = ft_1, j = "stat",
  labels = c(
    mean_sd = "Moyenne (ecart-type)",
    median_iqr = "Mediane (IQR)",
    range = "Etendue",
    missing = "Valeurs manquantes"
  )
)
ft_1 <- autofit(ft_1)
ft_1
Format mean and standard deviation as text
Description
Format means and standard deviations as mean (sd).
Usage
fmt_avg_dev(avg, dev, digit1 = 1, digit2 = 1)
Arguments
avg, dev |
mean and sd values |
digit1, digit2 |
number of digits to show when printing 'mean' and 'sd'. |
See Also
Other value formatters:
fmt_2stats(),
fmt_dbl(),
fmt_header_n(),
fmt_int(),
fmt_n_percent(),
fmt_pct(),
fmt_signif_after_zeros()
Examples
library(flextable)

df <- data.frame(avg = 1:3 * 3, sd = 1:3)

ft_1 <- flextable(df, col_keys = "avg")
ft_1 <- mk_par(
  x = ft_1, j = 1, part = "body",
  value = as_paragraph(fmt_avg_dev(avg = avg, dev = sd))
)
ft_1 <- autofit(ft_1)
ft_1
Format numbers as doubles
Description
Format numeric values with decimal digits, using the flextable default settings for separators and precision.
Usage
fmt_dbl(x)
Arguments
x |
numeric values |
See Also
Other value formatters:
fmt_2stats(),
fmt_avg_dev(),
fmt_header_n(),
fmt_int(),
fmt_n_percent(),
fmt_pct(),
fmt_signif_after_zeros()
Examples
library(flextable)

df <- data.frame(zz = .45)

ft_1 <- flextable(df)
ft_1 <- mk_par(
  x = ft_1, j = 1, part = "body",
  value = as_paragraph(as_chunk(zz, formatter = fmt_dbl))
)
ft_1 <- autofit(ft_1)
ft_1
Format count as '(N=XX)' for column headers
Description
Format counts as \n(N=XX) for appending
sample sizes to column titles.
Usage
fmt_header_n(n, newline = TRUE)
Arguments
n |
count values |
newline |
indicates to prefix the text with a new line (sof return). |
See Also
Other value formatters:
fmt_2stats(),
fmt_avg_dev(),
fmt_dbl(),
fmt_int(),
fmt_n_percent(),
fmt_pct(),
fmt_signif_after_zeros()
Examples
library(flextable)

df <- data.frame(zz = 1)

ft_1 <- flextable(df)
ft_1 <- append_chunks(
  x = ft_1, j = 1, part = "header",
  value = as_chunk(fmt_header_n(200))
)
ft_1 <- autofit(ft_1)
ft_1
Format numbers as integers
Description
Format numeric values as integers (no decimals).
Usage
fmt_int(x)
Arguments
x |
numeric values |
See Also
Other value formatters:
fmt_2stats(),
fmt_avg_dev(),
fmt_dbl(),
fmt_header_n(),
fmt_n_percent(),
fmt_pct(),
fmt_signif_after_zeros()
Examples
library(flextable)

df <- data.frame(zz = 1.23)

ft_1 <- flextable(df)
ft_1 <- mk_par(
  x = ft_1, j = 1, part = "body",
  value = as_paragraph(as_chunk(zz, formatter = fmt_int))
)
ft_1 <- autofit(ft_1)
ft_1
Format count and percentage as text
Description
Format counts and percentages as n (xx.x%).
If percentages are missing, only the count is shown.
Usage
fmt_n_percent(n, pct, digit = 1)
Arguments
n |
count values |
pct |
percent values |
digit |
number of digits for the percentages |
See Also
Other value formatters:
fmt_2stats(),
fmt_avg_dev(),
fmt_dbl(),
fmt_header_n(),
fmt_int(),
fmt_pct(),
fmt_signif_after_zeros()
Examples
library(flextable)

df <- structure(
  list(
    cut = structure(
      .Data = 1:5, levels = c(
        "Fair", "Good", "Very Good", "Premium", "Ideal"
      ),
      class = c("ordered", "factor")
    ),
    n = c(1610L, 4906L, 12082L, 13791L, 21551L),
    pct = c(0.0299, 0.0909, 0.2239, 0.2557, 0.3995)
  ),
  row.names = c(NA, -5L),
  class = "data.frame"
)

ft_1 <- flextable(df, col_keys = c("cut", "txt"))
ft_1 <- mk_par(
  x = ft_1, j = "txt",
  value = as_paragraph(fmt_n_percent(n, pct))
)
ft_1 <- align(ft_1, j = "txt", part = "all", align = "right")
ft_1 <- autofit(ft_1)
ft_1
Format numbers as percentages
Description
Format numeric values as percentages (e.g. "45.0%").
Usage
fmt_pct(x)
Arguments
x |
numeric values |
See Also
Other value formatters:
fmt_2stats(),
fmt_avg_dev(),
fmt_dbl(),
fmt_header_n(),
fmt_int(),
fmt_n_percent(),
fmt_signif_after_zeros()
Examples
library(flextable)

df <- data.frame(zz = .45)

ft_1 <- flextable(df)
ft_1 <- mk_par(
  x = ft_1, j = 1, part = "body",
  value = as_paragraph(as_chunk(zz, formatter = fmt_pct))
)
ft_1 <- autofit(ft_1)
ft_1
Format with significant figures after zeros
Description
Rounds significant figures after zeros in numeric vectors.
The number of digits displayed after the leading zeros is
customizable using the digits parameter.
Usage
fmt_signif_after_zeros(x, digits = 3)
Arguments
x |
numeric values |
digits |
number of digits displayed after the leading zeros |
See Also
Other value formatters:
fmt_2stats(),
fmt_avg_dev(),
fmt_dbl(),
fmt_header_n(),
fmt_int(),
fmt_n_percent(),
fmt_pct()
Examples
x <- data.frame(
  x = c(0.00000004567, 2.000003456, 3, pi)
)
ft_1 <- flextable(x)
ft_1 <- align(x = ft_1, j = 1, align = "left")
mk_par(ft_1, value = as_paragraph(
  fmt_signif_after_zeros(x)))
Set font
Description
Change the font of selected rows and columns of a flextable.
Fonts impact the readability and aesthetics of the table. Font families refer to a set of typefaces that share common design features, such as 'Arial' and 'Open Sans'.
'Google Fonts' is a popular library of free web fonts that can be
easily integrated into flextable with the gdtools::register_gfont() function.
When the output is HTML, the font will be automatically added to the HTML
document.
Usage
font(
  x,
  i = NULL,
  j = NULL,
  fontname,
  part = "body",
  cs.family = fontname,
  hansi.family = fontname,
  eastasia.family = fontname
)
Arguments
x |
a 'flextable' object, see flextable-package to learn how to create 'flextable' object. |
i |
row selector, see section Row selection with the |
j |
column selector, see section Column selection with the |
fontname |
single character value, the font family name. With Word and PowerPoint output, this value specifies the font to be used for formatting characters in the Unicode range (U+0000-U+007F). |
part |
part selector, see section Part selection with the |
cs.family |
Optional font to be used for formatting
characters in a complex script Unicode range. For example, Arabic
text might be displayed using the "Arial Unicode MS" font.
Used only with Word and PowerPoint outputs. The default value is the value
of |
hansi.family |
Optional font to be used for formatting
characters in a Unicode range that does not fall into one of the
other categories.
Used only with Word and PowerPoint outputs. The default value is the value
of |
eastasia.family |
Optional font to be used for
formatting characters in an East Asian Unicode range. For example,
Japanese text might be displayed using the "MS Mincho" font.
Used only with Word and PowerPoint outputs. The default value is the value
of |
See Also
Other formatting shortcuts:
align(),
bg(),
bold(),
color(),
empty_blanks(),
fontsize(),
highlight(),
indentation(),
italic(),
keep_with_next(),
line_spacing(),
padding(),
rotate(),
style(),
tab_settings(),
valign()
Examples
library(gdtools)
fontname <- "Brush Script MT"

if (font_family_exists(fontname)) {
  ft_1 <- flextable(head(iris))
  ft_2 <- font(ft_1, fontname = fontname, part = "header")
  ft_2 <- font(ft_2, fontname = fontname, j = 5)
  ft_2
}
Set font size
Description
Change the font size of selected rows and columns of a flextable.
Usage
fontsize(x, i = NULL, j = NULL, size = 11, part = "body")
Arguments
x |
a 'flextable' object, see flextable-package to learn how to create 'flextable' object. |
i |
row selector, see section Row selection with the |
j |
column selector, see section Column selection with the |
size |
integer value (points) |
part |
part selector, see section Part selection with the |
See Also
Other formatting shortcuts:
align(),
bg(),
bold(),
color(),
empty_blanks(),
font(),
highlight(),
indentation(),
italic(),
keep_with_next(),
line_spacing(),
padding(),
rotate(),
style(),
tab_settings(),
valign()
Examples
ft <- flextable(head(iris))
ft <- fontsize(ft, size = 14, part = "header")
ft <- fontsize(ft, size = 14, j = 2)
ft <- fontsize(ft, size = 7, j = 3)
ft
Add flextable at a bookmark location in document's footer
Description
Function is now defunct, use officer::prop_section() instead.
Usage
footers_flextable_at_bkm(...)
Arguments
... |
unused |
Add footnotes to flextable
Description
The function let add footnotes to a flextable object by adding some symbols in the flextable and associated notes in the footer of the flextable.
Symbols are added to the cells designated by the selection i
and j. If you use i = c(1,3) and j = c(2,5), then you will
add the symbols (or the repeated symbol) to cells [1,2]
and [3,5].
See https://www.ardata.fr/en/flextable-gallery/2022-06-23-separate-headers/ for the example
shown
Usage
footnote(
  x,
  i = NULL,
  j = NULL,
  value,
  ref_symbols = NULL,
  part = "body",
  inline = FALSE,
  sep = "; ",
  symbol_sep = ""
)
Arguments
x |
a 'flextable' object, see flextable-package to learn how to create 'flextable' object. |
i |
row selector, see section Row selection with the |
j |
column selector, see section Column selection with the |
value |
a call to function |
ref_symbols |
character value, symbols to append that will be used as references to notes. |
part |
part selector, see section Part selection with the |
inline |
whether to add footnote on same line as previous footnote or not |
sep |
used only when inline = TRUE, character string to use as a separator between footnotes. |
symbol_sep |
separator to insert between multiple
footnote symbols in the same cell (e.g. |
See Also
Other functions to compose cell content:
append_chunks(),
as_paragraph(),
compose(),
labelizor(),
prepend_chunks(),
void()
Examples
ft_1 <- flextable(head(iris))
ft_1 <- footnote(ft_1,
  i = 1, j = 1:3,
  value = as_paragraph(
    c(
      "This is footnote one",
      "This is footnote two",
      "This is footnote three"
    )
  ),
  ref_symbols = c("a", "b", "c"),
  part = "header"
)
ft_1 <- valign(ft_1, valign = "bottom", part = "header")
ft_1 <- autofit(ft_1)

ft_2 <- flextable(head(iris))
ft_2 <- autofit(ft_2)
ft_2 <- footnote(ft_2,
  i = 1, j = 1:2,
  value = as_paragraph(
    c(
      "This is footnote one",
      "This is footnote two"
    )
  ),
  ref_symbols = c("a", "b"),
  part = "header", inline = TRUE
)
ft_2 <- footnote(ft_2,
  i = 1, j = 3:4,
  value = as_paragraph(
    c(
      "This is footnote three",
      "This is footnote four"
    )
  ),
  ref_symbols = c("c", "d"),
  part = "header", inline = TRUE
)
ft_2

ft_3 <- flextable(head(iris))
ft_3 <- autofit(ft_3)
ft_3 <- footnote(
  x = ft_3, i = 1:3, j = 1:3,
  ref_symbols = "a",
  value = as_paragraph("This is footnote one")
)
ft_3
Create border formatting with flextable defaults
Description
Create a officer::fp_border() object whose unspecified
arguments inherit from set_flextable_defaults() (border color, width).
Use fp_border_default() instead of officer::fp_border() so that
borders automatically match the table's default style.
Usage
fp_border_default(
  color = flextable_global$defaults$border.color,
  style = "solid",
  width = flextable_global$defaults$border.width
)
Arguments
color |
border color - single character value (e.g. "#000000" or "black") |
style |
border style - single character value : See Details for supported border styles. |
width |
border width - an integer value : 0>= value |
See Also
Other default formatting properties:
fp_text_default()
Examples
library(flextable)

set_flextable_defaults(
  border.color = "orange"
)

z <- flextable(head(cars))
z <- theme_vanilla(z)
z <- vline(
  z,
  j = 1, part = "all",
  border = officer::fp_border()
)
z <- vline(
  z,
  j = 2, part = "all",
  border = fp_border_default()
)
z

init_flextable_defaults()
Create text formatting with flextable defaults
Description
Create a officer::fp_text() object whose unspecified
arguments inherit from set_flextable_defaults() (font family, size, color).
Use fp_text_default() instead of officer::fp_text() when building
chunks with as_chunk(): only override the properties you need,
and the rest will match the table's default style.
See also set_flextable_defaults() to modify the inherited values.
Usage
fp_text_default(
  color = flextable_global$defaults$font.color,
  font.size = flextable_global$defaults$font.size,
  bold = FALSE,
  italic = FALSE,
  underlined = FALSE,
  strike = FALSE,
  font.family = flextable_global$defaults$font.family,
  cs.family = NULL,
  eastasia.family = NULL,
  hansi.family = NULL,
  vertical.align = "baseline",
  shading.color = "transparent"
)
Arguments
color |
font color - a single character value specifying a valid color (e.g. "#000000" or "black"). |
font.size |
font size (in point) - 0 or positive integer value. |
bold |
is bold |
italic |
is italic |
underlined |
is underlined |
strike |
is strikethrough |
font.family |
single character value. Specifies the font to be used to format characters in the Unicode range (U+0000-U+007F). |
cs.family |
optional font to be used to format characters in a complex script Unicode range. For example, Arabic text might be displayed using the "Arial Unicode MS" font. |
eastasia.family |
optional font to be used to format characters in an East Asian Unicode range. For example, Japanese text might be displayed using the "MS Mincho" font. |
hansi.family |
optional. Specifies the font to be used to format characters in a Unicode range which does not fall into one of the other categories. |
vertical.align |
single character value specifying font vertical alignments.
Expected value is one of the following : default |
shading.color |
shading color - a single character value specifying a valid color (e.g. "#000000" or "black"). |
See Also
as_chunk(), compose(), append_chunks(), prepend_chunks()
Other default formatting properties:
fp_border_default()
Examples
library(flextable)

set_flextable_defaults(
  font.size = 11, font.color = "#303030",
  padding = 3, table.layout = "autofit"
)
z <- flextable(head(cars))

z <- compose(
  x = z,
  i = ~ speed < 6,
  j = "speed",
  value = as_paragraph(
    as_chunk("slow... ", props = fp_text_default(color = "red")),
    as_chunk(speed, props = fp_text_default(italic = TRUE))
  )
)
z

init_flextable_defaults()
Render a flextable as a graphic object
Description
gen_grob() converts a flextable into a Grid Graphics
object (grob) that can be drawn on any R graphic device.
This is the function behind save_as_image() and the
patchwork integration (wrap_flextable()).
Typical uses:
embed a flextable in a
ggplot2plot (viawrap_flextable()or cowplot)export a flextable as a PNG or SVG image (via
save_as_image())
Text wrapping and scaling are supported. The fit
argument controls how the table adapts to the available
space (fixed size, auto-fit width, or fill the device).
Not recommended for very large tables because the grid calculations can be slow.
Limitations: equations (as_equation()) and hyperlinks
(officer::hyperlink_ftext()) are not rendered.
Use a 'ragg', 'svglite' or 'ggiraph' device for correct rendering.
Usage
gen_grob(
  x,
  ...,
  fit = c("auto", "width", "fixed"),
  scaling = c("min", "full", "fixed"),
  wrapping = TRUE,
  autowidths = TRUE,
  just = NULL
)
Arguments
x |
a 'flextable' object, see flextable-package to learn how to create 'flextable' object. |
... |
Reserved for extra arguments |
fit |
Determines the fitting/scaling of the grob on its parent viewport.
One of
|
scaling |
Determines the scaling of the table contents.
One of
|
wrapping |
Determines the soft wrapping (line breaking) method
for the table cell contents. One of
Superscript and subscript chunks do not wrap. Newline and tab characters are removed from these chunk types. |
autowidths |
If |
just |
Justification of viewport layout,
same as |
Value
a grob (gTree) object made with package grid
size
The size of the flextable can be known by using the method dim on the grob.
caption
It's important to note that captions are not part of the table itself. This means when exporting a table to PNG or SVG formats (image formats), the caption won't be included. Captions are intended for document outputs like Word, HTML, or PDF, where tables are embedded within the document itself.
See Also
Other functions for flextable output and export:
df_printer(),
flextable_to_rmd(),
htmltools_value(),
knit_print.flextable(),
plot.flextable(),
print.flextable(),
repair_docx(),
save_as_docx(),
save_as_html(),
save_as_image(),
save_as_pptx(),
save_as_rtf(),
to_html.flextable(),
wrap_flextable()
Examples
library(ragg)
library(gdtools)
register_liberationsans()

set_flextable_defaults(font.family = "Liberation Sans")

ft <- flextable(head(mtcars))
gr <- gen_grob(ft)

plot(gr)
Get flextable defaults formatting properties
Description
The current formatting properties are automatically applied to every flextable you produce. These default values are returned by this function.
Usage
get_flextable_defaults()
Value
a list containing default values.
See Also
Other themes and defaults:
set_flextable_defaults(),
theme_alafoli(),
theme_apa(),
theme_booktabs(),
theme_borderless(),
theme_box(),
theme_tron(),
theme_tron_legacy(),
theme_vader(),
theme_vanilla(),
theme_zebra()
Examples
get_flextable_defaults()
ggplot chunk
Description
This function is used to insert mini gg plots into flextable with functions:
Usage
gg_chunk(value, width = 1, height = 0.2, unit = "in", res = 300, alt = "")
Arguments
value |
gg objects, stored in a list column; or a list of 'ggplot' objects. |
width, height |
size of the resulting png file. |
unit |
unit for width and height, one of "in", "cm", "mm". |
res |
resolution of the png image in ppi |
alt |
alternative text for the image (used for accessibility) |
Note
This chunk option requires package officedown in a R Markdown
context with Word output format. With Quarto (format: docx) or
rmarkdown::word_document(), the resulting file must be repaired
with repair_docx().
PowerPoint cannot mix images and text in a paragraph, images are removed when outputing to PowerPoint format.
See Also
Other chunk elements for paragraph:
as_b(),
as_bracket(),
as_chunk(),
as_equation(),
as_highlight(),
as_i(),
as_image(),
as_qmd(),
as_strike(),
as_sub(),
as_sup(),
as_word_field(),
colorize(),
grid_chunk(),
hyperlink_text(),
linerange(),
minibar(),
plot_chunk()
Examples
library(data.table)
library(flextable)
if (require("ggplot2")) {
  my_cor_plot <- function(x) {
    cols <- colnames(x)[sapply(x, is.numeric)]
    x <- x[, .SD, .SDcols = cols]
    cormat <- as.data.table(cor(x))
    cormat$var1 <- colnames(cormat)
    cormat <- melt(cormat,
      id.vars = "var1", measure.vars = cormat$var1,
      variable.name = "var2", value.name = "correlation"
    )
    ggplot(data = cormat, aes(x = var1, y = var2, fill = correlation)) +
      geom_tile() +
      coord_equal() +
      scale_fill_gradient2(
        low = "blue",
        mid = "white", high = "red", limits = c(-1, 1),
        guide = "none"
      ) +
      theme_void()
  }
  z <- as.data.table(iris)
  z <- z[, list(gg = list(my_cor_plot(.SD))), by = "Species"]
  ft <- flextable(z)
  ft <- mk_par(ft,
    j = "gg",
    value = as_paragraph(
      gg_chunk(value = gg, width = 1, height = 1)
    )
  )
  ft
}
Grid Graphics chunk
Description
This function is used to insert grid objects into flextable with functions:
Usage
grid_chunk(value, width = 1, height = 0.2, unit = "in", res = 300, alt = "")
Arguments
value |
grid objects, stored in a list column; or a list of grid objects. |
width, height |
size of the resulting png file |
unit |
unit for width and height, one of "in", "cm", "mm". |
res |
resolution of the png image in ppi |
alt |
alternative text for the image (used for accessibility) |
Note
This chunk option requires package officedown in a R Markdown
context with Word output format. With Quarto (format: docx) or
rmarkdown::word_document(), the resulting file must be repaired
with repair_docx().
PowerPoint cannot mix images and text in a paragraph, images are removed when outputing to PowerPoint format.
See Also
Other chunk elements for paragraph:
as_b(),
as_bracket(),
as_chunk(),
as_equation(),
as_highlight(),
as_i(),
as_image(),
as_qmd(),
as_strike(),
as_sub(),
as_sup(),
as_word_field(),
colorize(),
gg_chunk(),
hyperlink_text(),
linerange(),
minibar(),
plot_chunk()
Examples
library(flextable)
ft_1 <- flextable(head(cars))
if (require("grid")) {
  ft_1 <- prepend_chunks(
    x = ft_1, i = 2, j = 2,
    grid_chunk(
      list(
        circleGrob(gp = gpar(
          fill = "#ec11c2",
          col = "transparent"
        ))
      ),
      width = .15, height = .15
    )
  )
}
ft_1
Add flextable at a bookmark location in document's header
Description
Function is now defunct, use officer::prop_section() instead.
Usage
headers_flextable_at_bkm(...)
Arguments
... |
unused |
Set flextable rows height
Description
control rows height for a part of the flextable when the line
height adjustment is "atleast" or "exact" (see hrule()).
Usage
height(x, i = NULL, height, part = "body", unit = "in")

height_all(x, height, part = "all", unit = "in")
Arguments
x |
a 'flextable' object, see flextable-package to learn how to create 'flextable' object. |
i |
row selector, see section Row selection with the |
height |
height in inches |
part |
part selector, see section Part selection with the |
unit |
unit for height, one of "in", "cm", "mm". |
height_all
height_all is a convenient function for
setting the same height to all rows (selected
with argument part).
Note
This function has no effect when the rule for line height is set to
"auto" (see hrule()), which is the default case, except with PowerPoint
which does not support this automatic line height adjustment feature.
See Also
Other functions for flextable size management:
autofit(),
dim.flextable(),
dim_pretty(),
fit_columns(),
fit_to_width(),
flextable_dim(),
hrule(),
ncol_keys(),
nrow_part(),
set_table_properties(),
width()
Examples
ft_1 <- flextable(head(iris))
ft_1 <- height(ft_1, height = .5)
ft_1 <- hrule(ft_1, rule = "exact")
ft_1


ft_2 <- flextable(head(iris))
ft_2 <- height_all(ft_2, height = 1)
ft_2 <- hrule(ft_2, rule = "exact")
ft_2
Set text highlight color
Description
Change the text highlight color of selected rows and columns of a flextable. A function can be used instead of fixed colors.
When color is a function, it is possible to color cells based on values
located in other columns; using hidden columns (those not used by
argument colkeys) is a common use case. The argument source
must be used to define the columns to be used for the color
definition, and the argument j must be used to define where to apply
the colors and only accepts values from colkeys.
Usage
highlight(x, i = NULL, j = NULL, color = "yellow", part = "body", source = j)
Arguments
x |
a 'flextable' object, see flextable-package to learn how to create 'flextable' object. |
i |
row selector, see section Row selection with the |
j |
column selector, see section Column selection with the |
color |
color to use as text highlighting color. If a function, the function must return a character vector of colors. |
part |
part selector, see section Part selection with the |
source |
if color is a function, source specifies the dataset column to be used
as an argument to |
See Also
Other formatting shortcuts:
align(),
bg(),
bold(),
color(),
empty_blanks(),
font(),
fontsize(),
indentation(),
italic(),
keep_with_next(),
line_spacing(),
padding(),
rotate(),
style(),
tab_settings(),
valign()
Examples
my_color_fun <- function(x) {
  out <- rep("yellow", length(x))
  out[x < quantile(x, .75)] <- "pink"
  out[x < quantile(x, .50)] <- "wheat"
  out[x < quantile(x, .25)] <- "gray90"
  out
}
ft <- flextable(head(mtcars, n = 10))
ft <- highlight(ft, j = "disp", i = ~ disp > 200, color = "yellow")
ft <- highlight(ft, j = ~ drat + wt + qsec, color = my_color_fun)
ft
Set horizontal borders below selected rows
Description
hline() draws a horizontal line below each selected row by
setting the bottom border of cells at row i (and the top border
of cells at row i + 1 so that the line renders consistently
across output formats).
Use the i selector to target specific rows (e.g. a formula
such as ~ before(col, "Total")). When i is NULL (the
default) the border is added below every row, which produces
a full grid of inner horizontal lines.
For the outer edges of the table, use hline_top() and
hline_bottom() instead; those always target the very first
or very last row of a part.
Usage
hline(x, i = NULL, j = NULL, border = NULL, part = "body")
Arguments
x |
a 'flextable' object, see flextable-package to learn how to create 'flextable' object. |
i |
row selector, see section Row selection with the |
j |
column selector, see section Column selection with the |
border |
border properties defined by a call to
|
part |
part selector, see section Part selection with the |
See Also
Other borders management:
border_inner(),
border_inner_h(),
border_inner_v(),
border_outer(),
border_remove(),
hline_bottom(),
hline_top(),
surround(),
vline(),
vline_left(),
vline_right()
Examples
library(officer)
std_border <- fp_border(color = "gray")

ft <- flextable(head(iris))
ft <- border_remove(x = ft)

# add horizontal borders below every row
ft <- hline(ft, part = "all", border = std_border)
ft
Set the bottom border of a table part
Description
hline_bottom() draws a horizontal line at the very bottom
of a table part. It does not accept a row selector i because
it always targets the last row.
Unlike hline(), which adds inner lines below arbitrary rows,
hline_bottom() is meant for the outer bottom edge of a part.
Usage
hline_bottom(x, j = NULL, border = NULL, part = "body")
Arguments
x |
a 'flextable' object, see flextable-package to learn how to create 'flextable' object. |
j |
column selector, see section Column selection with the |
border |
border properties defined by a call to
|
part |
part selector, see section Part selection with the |
See Also
Other borders management:
border_inner(),
border_inner_h(),
border_inner_v(),
border_outer(),
border_remove(),
hline(),
hline_top(),
surround(),
vline(),
vline_left(),
vline_right()
Examples
library(officer)
big_border <- fp_border(color = "orange", width = 3)

ft <- flextable(head(iris))
ft <- border_remove(x = ft)

# add a thick line at the bottom of the body
ft <- hline_bottom(ft, part = "body", border = big_border)
ft
Set the top border of a table part
Description
hline_top() draws a horizontal line at the very top of a
table part. It does not accept a row selector i because it
always targets the first row.
When the part above exists (e.g. header above body), the line is stored as the bottom border of that adjacent part so that it renders seamlessly.
Unlike hline(), which adds inner lines below arbitrary rows,
hline_top() is meant for the outer top edge of a part.
Usage
hline_top(x, j = NULL, border = NULL, part = "body")
Arguments
x |
a 'flextable' object, see flextable-package to learn how to create 'flextable' object. |
j |
column selector, see section Column selection with the |
border |
border properties defined by a call to
|
part |
part selector, see section Part selection with the |
See Also
Other borders management:
border_inner(),
border_inner_h(),
border_inner_v(),
border_outer(),
border_remove(),
hline(),
hline_bottom(),
surround(),
vline(),
vline_left(),
vline_right()
Examples
library(officer)
big_border <- fp_border(color = "orange", width = 3)

ft <- flextable(head(iris))
ft <- border_remove(x = ft)

# add a thick line on top of each part
ft <- hline_top(ft, part = "all", border = big_border)
ft
Set how row heights are determined
Description
hrule() controls whether row heights are automatic,
minimum or fixed. This only affects Word and PowerPoint
outputs; it has no effect on HTML or PDF.
-
"auto"(default): the row height adjusts to fit the content; any value set byheight()is ignored. -
"atleast": the row is at least as tall as the value set byheight(), but can grow if the content is taller. -
"exact": the row is exactly the height set byheight(); content that overflows is clipped.
For PDF see the ft.arraystretch chunk option.
Usage
hrule(x, i = NULL, rule = "auto", part = "body")
Arguments
x |
a 'flextable' object, see flextable-package to learn how to create 'flextable' object. |
i |
row selector, see section Row selection with the |
rule |
specify the meaning of the height. Possible values are "atleast" (height should be at least the value specified), "exact" (height should be exactly the value specified), or the default value "auto" (height is determined based on the height of the contents, so the value is ignored). |
part |
part selector, see section Part selection with the |
See Also
Other functions for flextable size management:
autofit(),
dim.flextable(),
dim_pretty(),
fit_columns(),
fit_to_width(),
flextable_dim(),
height(),
ncol_keys(),
nrow_part(),
set_table_properties(),
width()
Examples
ft_1 <- flextable(head(iris))
ft_1 <- width(ft_1, width = 1.5)
ft_1 <- height(ft_1, height = 0.75, part = "header")
ft_1 <- hrule(ft_1, rule = "exact", part = "header")
ft_1

ft_2 <- hrule(ft_1, rule = "auto", part = "header")
ft_2
Convert a flextable to an HTML object
Description
get a htmltools::div() from a flextable object.
This can be used in a shiny application. For an output within
"R Markdown" document, use knit_print.flextable.
Usage
htmltools_value(
  x,
  ft.align = NULL,
  ft.shadow = NULL,
  extra_dependencies = NULL
)
Arguments
x |
a 'flextable' object, see flextable-package to learn how to create 'flextable' object. |
ft.align |
flextable alignment, supported values are 'left', 'center' and 'right'. |
ft.shadow |
deprecated. |
extra_dependencies |
a list of HTML dependencies to add in the HTML output. |
Value
an object marked as htmltools::HTML ready to be used within
a call to shiny::renderUI for example.
See Also
Other functions for flextable output and export:
df_printer(),
flextable_to_rmd(),
gen_grob(),
knit_print.flextable(),
plot.flextable(),
print.flextable(),
repair_docx(),
save_as_docx(),
save_as_html(),
save_as_image(),
save_as_pptx(),
save_as_rtf(),
to_html.flextable(),
wrap_flextable()
Examples
htmltools_value(flextable(iris[1:5, ]))
Hyperlink chunk
Description
The function lets add hyperlinks within flextable objects.
It is used to add it to the content of a cell of the
flextable with the functions compose(), append_chunks()
or prepend_chunks().
URL are not encoded, they are preserved 'as is'.
Usage
hyperlink_text(x, props = NULL, formatter = format_fun, url, ...)
Arguments
x |
text or any element that can be formatted as text
with function provided in argument |
props |
an |
formatter |
a function that will format x as a character vector. |
url |
url to be used |
... |
additional arguments for |
Note
This chunk option requires package officedown in a R Markdown
context with Word output format. With Quarto (format: docx) or
rmarkdown::word_document(), the resulting file must be repaired
with repair_docx().
See Also
Other chunk elements for paragraph:
as_b(),
as_bracket(),
as_chunk(),
as_equation(),
as_highlight(),
as_i(),
as_image(),
as_qmd(),
as_strike(),
as_sub(),
as_sup(),
as_word_field(),
colorize(),
gg_chunk(),
grid_chunk(),
linerange(),
minibar(),
plot_chunk()
Examples
dat <- data.frame(
  col = "Google it",
  href = "https://www.google.fr/search?source=hp&q=flextable+R+package",
  stringsAsFactors = FALSE
)

ftab <- flextable(dat)
ftab <- compose(
  x = ftab, j = "col",
  value = as_paragraph(
    "This is a link: ",
    hyperlink_text(x = col, url = href)
  )
)
ftab
Set paragraph indents
Description
Change the first-line or hanging indent of paragraphs in selected rows and columns of a flextable.
A first-line indent moves only the first line of the paragraph to the
right. A hanging indent moves all lines but the first one to the
right; the indented lines start at the paragraph left padding plus the
hanging value, so hanging should not exceed the left padding
(see padding()).
Usage
indentation(
  x,
  i = NULL,
  j = NULL,
  first_line = NULL,
  hanging = NULL,
  part = "body"
)
Arguments
x |
a 'flextable' object, see flextable-package to learn how to create 'flextable' object. |
i |
row selector, see section Row selection with the |
j |
column selector, see section Column selection with the |
first_line |
first-line indent in pts (points). Use NA to unset. |
hanging |
hanging indent in pts (points). Use NA to unset. If both
|
part |
part selector, see section Part selection with the |
See Also
Other formatting shortcuts:
align(),
bg(),
bold(),
color(),
empty_blanks(),
font(),
fontsize(),
highlight(),
italic(),
keep_with_next(),
line_spacing(),
padding(),
rotate(),
style(),
tab_settings(),
valign()
Examples
ft_1 <- flextable(head(iris))
ft_1 <- mk_par(
  x = ft_1, i = 1, j = 1, part = "header",
  value = as_paragraph("A rather long header that will wrap on two lines")
)
ft_1 <- padding(ft_1, i = 1, j = 1, padding.left = 30, part = "header")
ft_1 <- indentation(ft_1, i = 1, j = 1, hanging = 20, part = "header")
ft_1 <- width(ft_1, j = 1, width = 1.2)
ft_1
Get cell-level information from a flextable
Description
This function takes a flextable object and returns a data.frame containing information about each cell within the flextable. The data.frame includes details about formatting properties and position within the row and column.
Usage
information_data_cell(x)
Arguments
x |
a 'flextable' object, see flextable-package to learn how to create 'flextable' object. |
Value
a data.frame containing information about cells:
formatting properties,
part (
.part), row (.row_id) and column (.col_id).
don't use this
These data structures should not be used, as they represent an interpretation of the underlying data structures, which may evolve over time.
They are exported to enable two packages that exploit these structures to make a transition, and should not remain available for long.
See Also
Other table data extraction:
information_data_chunk(),
information_data_paragraph()
Examples
ft <- as_flextable(iris)
x <- information_data_cell(ft)
head(x)
Get chunk-level content information from a flextable
Description
This function takes a flextable object and returns a data.frame containing information about each text chunk within the flextable. The data.frame includes details such as the text content, formatting properties, position within the paragraph, paragraph row, and column.
Usage
information_data_chunk(x, expand_special_chars = TRUE)
Arguments
x |
a 'flextable' object, see flextable-package to learn how to create 'flextable' object. |
Value
a data.frame containing information about chunks:
text chunk (column
txt) and other content (urlfor the linked url,eq_datafor content of type 'equation',word_field_datafor content of type 'word_field' andimg_datafor content of type 'image'),formatting properties,
part (
.part), position within the paragraph (.chunk_index), row (.row_id) and column (.col_id).
don't use this
These data structures should not be used, as they represent an interpretation of the underlying data structures, which may evolve over time.
They are exported to enable two packages that exploit these structures to make a transition, and should not remain available for long.
See Also
Other table data extraction:
information_data_cell(),
information_data_paragraph()
Examples
ft <- as_flextable(iris)
x <- information_data_chunk(ft)
head(x)
Get paragraph-level information from a flextable
Description
This function takes a flextable object and returns a data.frame containing information about each paragraph within the flextable. The data.frame includes details about formatting properties and position within the row and column.
Usage
information_data_paragraph(x)
Arguments
x |
a 'flextable' object, see flextable-package to learn how to create 'flextable' object. |
Value
a data.frame containing information about paragraphs:
formatting properties,
part (
.part), row (.row_id) and column (.col_id).
don't use this
These data structures should not be used, as they represent an interpretation of the underlying data structures, which may evolve over time.
They are exported to enable two packages that exploit these structures to make a transition, and should not remain available for long.
See Also
Other table data extraction:
information_data_cell(),
information_data_chunk()
Examples
ft <- as_flextable(iris)
x <- information_data_paragraph(ft)
head(x)
Set italic font
Description
Change the font decoration of selected rows and columns of a flextable.
Usage
italic(x, i = NULL, j = NULL, italic = TRUE, part = "body")
Arguments
x |
a 'flextable' object, see flextable-package to learn how to create 'flextable' object. |
i |
row selector, see section Row selection with the |
j |
column selector, see section Column selection with the |
italic |
boolean value |
part |
part selector, see section Part selection with the |
See Also
Other formatting shortcuts:
align(),
bg(),
bold(),
color(),
empty_blanks(),
font(),
fontsize(),
highlight(),
indentation(),
keep_with_next(),
line_spacing(),
padding(),
rotate(),
style(),
tab_settings(),
valign()
Examples
ft <- flextable(head(mtcars))
ft <- italic(ft, italic = TRUE, part = "header")
Set Word 'Keep with next' instructions
Description
The 'Keep with next' functionality in 'Word', applied to the rows of a table, ensures that rows with that attribute stay together and do not break across multiple pages.
This function provides better control of page breaks than
the global keep_with_next parameter.
Usage
keep_with_next(x, i = NULL, value = TRUE, part = "body")
Arguments
x |
a 'flextable' object, see flextable-package to learn how to create 'flextable' object. |
i |
row selector, see section Row selection with the |
value |
TRUE or FALSE. When applied to a group, all rows except the last one should be flagged with the 'Keep with next' attribute. |
part |
part selector, see section Part selection with the |
See Also
Other formatting shortcuts:
align(),
bg(),
bold(),
color(),
empty_blanks(),
font(),
fontsize(),
highlight(),
indentation(),
italic(),
line_spacing(),
padding(),
rotate(),
style(),
tab_settings(),
valign()
Examples
library(flextable)
dat <- iris[c(1:25, 51:75, 101:125), ]
ft <- qflextable(dat)
ft <- keep_with_next(
  x = ft,
  i = c(1:24, 26:49, 51:74),
  value = TRUE
)

save_as_docx(ft, path = tempfile(fileext = ".docx"))
Render flextable in knitr documents
Description
This function is called automatically by knitr to display a flextable in R Markdown and Quarto documents. You do not need to call it directly.
Supported output formats: HTML, Word (docx), PDF, PowerPoint (pptx) and
Typst (format: typst, Quarto only). For other formats (e.g.,
github_document, beamer_presentation), the table is rendered as a
PNG image.
Usage
## S3 method for class 'flextable'
knit_print(x, ...)
Arguments
x |
a 'flextable' object, see flextable-package to learn how to create 'flextable' object. |
... |
unused. |
Getting started
No special setup is needed: place a flextable object in a code chunk and it will be rendered in the output document.
Add a caption with set_caption():
ft <- set_caption(ft, caption = "My table caption")
In Quarto documents, use chunk options tbl-cap and label instead:
```{r}
#| label: tbl-mytable
#| tbl-cap: "My table caption"
ft
```
Captions
Recommended method: use set_caption() to define the caption
directly on the flextable object. When set_caption() is used,
chunk options related to captions are ignored.
Alternative (R Markdown only): use knitr chunk options tab.cap
and tab.id:
| Description | Chunk option | Default |
| Caption text | tab.cap | NULL |
| Caption id/bookmark | tab.id | NULL |
| Caption on top of the table | tab.topcaption | TRUE |
| Caption sequence identifier | tab.lp | "tab:" |
| Word style for captions | tab.cap.style | NULL |
Bookdown: cross-references use the pattern
\@ref(tab:chunk_label). The usual bookdown numbering applies.
Quarto: cross-references use @tbl-chunk_label. To embed
cross-references or other Quarto markdown inside flextable cells,
use as_qmd() with the flextable-qmd extension
(see use_flextable_qmd()).
Chunk options
Use knitr::opts_chunk$set(...) to set defaults for the whole document.
All formats:
-
ft.align: table alignment, one of'left','center'(default) or'right'.
HTML:
-
ft.htmlscroll:TRUEorFALSE(default) to enable horizontal scrolling. Seeset_table_properties()for finer control.
Word:
-
ft.split: allow rows to break across pages (TRUEby default).
PDF:
-
ft.tabcolsep: space between text and cell borders (default 0 pt). -
ft.arraystretch: row height multiplier (default 1.5). -
ft.latex.float: floating placement. One of'none'(default),'float','wrap-r','wrap-l','wrap-i','wrap-o'.
PowerPoint:
-
ft.left,ft.top: top-left coordinates of the table placeholder in inches (defaults: 1 and 2).
Word with officedown
When using officedown::rdocx_document(), additional caption options
are available:
| Description | Chunk option | Default |
| Numbering prefix | tab.cap.pre | "Table " |
| Numbering suffix | tab.cap.sep | ": " |
| Title number depth | tab.cap.tnd | 0 |
| Caption prefix formatting | tab.cap.fp_text | fp_text_lite(bold=TRUE) |
| Title number / table number separator | tab.cap.tns | "-" |
Quarto
flextable works natively in Quarto documents for HTML, PDF, Word and Typst.
The flextable-qmd Lua filter extension enables Quarto markdown
inside flextable cells: cross-references (@tbl-xxx, @fig-xxx),
bold/italic, links, math, inline code and shortcodes.
See as_qmd() and use_flextable_qmd() for setup instructions.
PDF accessibility (PDF/UA-2)
Quarto's pdf-standard: ua-2 injects \DocumentMetadata{tagging=on}
in the LaTeX preamble, activating 'tagpdf'.
This code patches LaTeX commands at compile time to insert
PDF structure tags. Neither Quarto nor flextable control this process.
The tagging code does not yet support longtable + colortbl,
booktabs rules, and cline, which flextable relies on. Compilation
fails with \ERRORtbl/row. When these upstream issues are resolved,
flextable PDF output will support tagging without changes. Other formats are
not affected.
PDF limitations
The following properties are not supported in PDF output:
padding.top, padding.bottom, line_spacing and row height.
Justified text is converted to left-aligned.
To use system fonts, set latex_engine: xelatex in the YAML
header (the default pdflatex engine does not support them).
See add_latex_dep() when caching flextable results.
PowerPoint limitations
PowerPoint only supports fixed table layout. Use autofit() to
adjust column widths. Images inside table cells are not supported
(this is a PowerPoint limitation).
HTML note
HTML output uses Shadow DOM to isolate table styles from the rest of the page.
See Also
set_caption(), as_qmd(), use_flextable_qmd(),
paginate()
Other functions for flextable output and export:
df_printer(),
flextable_to_rmd(),
gen_grob(),
htmltools_value(),
plot.flextable(),
print.flextable(),
repair_docx(),
save_as_docx(),
save_as_html(),
save_as_image(),
save_as_pptx(),
save_as_rtf(),
to_html.flextable(),
wrap_flextable()
Examples
## Not run:
library(rmarkdown)
if (pandoc_available() &&
  pandoc_version() > numeric_version("2")) {
  demo_loop <- system.file(
    package = "flextable",
    "examples/rmd",
    "demo.Rmd"
  )
  rmd_file <- tempfile(fileext = ".Rmd")
  file.copy(demo_loop, to = rmd_file, overwrite = TRUE)
  render(
    input = rmd_file, output_format = "html_document",
    output_file = "demo.html"
  )
}

## End(Not run)
Replace displayed text with labels
Description
labelizor() substitutes text values shown in a flextable
with human-readable labels. This is useful to turn column
values such as variable names, factor levels or coded strings
into presentation-ready wording (e.g. "Sepal.Length" to
"Sepal Length").
labels can be either a named character vector (names
identify values to find, values are the replacement labels)
or a function applied to every text chunk (e.g. toupper()).
Only the displayed content is affected; the underlying data of the flextable is unchanged.
Usage
labelizor(x, j = NULL, labels, part = "all")
Arguments
x |
a 'flextable' object, see flextable-package to learn how to create 'flextable' object. |
j |
column selector, see section Column selection with the |
labels |
a named vector whose names will be used to identify values to replace and values will be used as labels. |
part |
part selector, see section Part selection with the |
See Also
mk_par(), append_chunks(), prepend_chunks()
Other functions to compose cell content:
append_chunks(),
as_paragraph(),
compose(),
footnote(),
prepend_chunks(),
void()
Examples
z <- summarizor(
  x = CO2[-c(1, 4)],
  by = "Treatment",
  overall_label = "Overall"
)

ft_1 <- as_flextable(z, separate_with = "variable")

ft_1 <- labelizor(
  x = ft_1, j = c("stat"),
  labels = c(Missing = "Kouign amann")
)

ft_1 <- labelizor(
  x = ft_1, j = c("variable"),
  labels = toupper
)

ft_1
Set line spacing
Description
Change the line spacing of selected rows and columns of a flextable.
Usage
line_spacing(x, i = NULL, j = NULL, space = 1, part = "body")
Arguments
x |
a 'flextable' object, see flextable-package to learn how to create 'flextable' object. |
i |
row selector, see section Row selection with the |
j |
column selector, see section Column selection with the |
space |
space between lines of text; 1 is single line spacing, 2 is double line spacing. |
part |
part selector, see section Part selection with the |
See Also
Other formatting shortcuts:
align(),
bg(),
bold(),
color(),
empty_blanks(),
font(),
fontsize(),
highlight(),
indentation(),
italic(),
keep_with_next(),
padding(),
rotate(),
style(),
tab_settings(),
valign()
Examples
ft <- flextable(head(mtcars)[, 3:6])
ft <- line_spacing(ft, space = 1.6, part = "all")
ft <- set_table_properties(ft, layout = "autofit")
ft
Mini linerange chunk
Description
This function is used to insert lineranges into flextable with functions:
Usage
linerange(
  value,
  min = NULL,
  max = NULL,
  rangecol = "#CCCCCC",
  stickcol = "#FF0000",
  bg = "transparent",
  width = 1,
  height = 0.2,
  raster_width = 30,
  unit = "in",
  alt = ""
)
Arguments
value |
values containing the bar size |
min |
min bar size. Default min of value |
max |
max bar size. Default max of value |
rangecol |
bar color |
stickcol |
jauge color |
bg |
background color |
width, height |
size of the resulting png file in inches |
raster_width |
number of pixels used as width when interpolating value. |
unit |
unit for width and height, one of "in", "cm", "mm". |
alt |
alternative text for the image (used for accessibility) |
Note
This chunk option requires package officedown in a R Markdown
context with Word output format. With Quarto (format: docx) or
rmarkdown::word_document(), the resulting file must be repaired
with repair_docx().
PowerPoint cannot mix images and text in a paragraph, images are removed when outputing to PowerPoint format.
See Also
Other chunk elements for paragraph:
as_b(),
as_bracket(),
as_chunk(),
as_equation(),
as_highlight(),
as_i(),
as_image(),
as_qmd(),
as_strike(),
as_sub(),
as_sup(),
as_word_field(),
colorize(),
gg_chunk(),
grid_chunk(),
hyperlink_text(),
minibar(),
plot_chunk()
Examples
myft <- flextable(head(iris, n = 10))

myft <- compose(myft,
  j = 1,
  value = as_paragraph(
    linerange(value = Sepal.Length)
  ),
  part = "body"
)

autofit(myft)
Mini lollipop chart chunk wrapper
Description
Function is now defunct, use gg_chunk() instead.
Usage
lollipop(...)
Merge flextable cells into a single one
Description
Merge flextable cells into a single one. All rows and columns must be consecutive.
Usage
merge_at(x, i = NULL, j = NULL, part = "body")
Arguments
x |
a 'flextable' object, see flextable-package to learn how to create 'flextable' object. |
i |
row selector, see section Row selection with the |
j |
column selector, see section Column selection with the |
part |
part selector, see section Part selection with the |
See Also
Other cell merging functions:
merge_h(),
merge_h_range(),
merge_none(),
merge_v()
Examples
ft_merge <- flextable(head(mtcars), cwidth = .5)
ft_merge <- merge_at(ft_merge, i = 1:2, j = 1:2)
ft_merge
Merge flextable cells horizontally
Description
Merge flextable cells horizontally when consecutive cells have identical values. Text of formatted values are used to compare values.
Usage
merge_h(x, i = NULL, part = "body")
Arguments
x |
a 'flextable' object, see flextable-package to learn how to create 'flextable' object. |
i |
row selector, see section Row selection with the |
part |
part selector, see section Part selection with the |
See Also
Other cell merging functions:
merge_at(),
merge_h_range(),
merge_none(),
merge_v()
Examples
library(flextable)

schedule <- data.frame(
  time = c("9h", "10h", "11h", "14h", "15h", "16h"),
  monday = c("Math", "Math", "French", "History", "Science", "French"),
  tuesday = c("English", "Math", "Art", "Math", "Math", "French"),
  wednesday = c("Science", "Math", "Science", "English", "English", "French"),
  stringsAsFactors = FALSE
)

ft <- flextable(schedule)
ft <- theme_box(ft)
ft <- merge_h(ft)
ft
Rowwise merge of a range of columns
Description
Merge flextable columns into a single one for each selected rows. All columns must be consecutive.
Usage
merge_h_range(x, i = NULL, j1 = NULL, j2 = NULL, part = "body")
Arguments
x |
a 'flextable' object, see flextable-package to learn how to create 'flextable' object. |
i |
row selector, see section Row selection with the |
j1, j2 |
selected columns that will define the range of columns to merge. |
part |
part selector, see section Part selection with the |
See Also
Other cell merging functions:
merge_at(),
merge_h(),
merge_none(),
merge_v()
Examples
ft <- flextable(head(mtcars), cwidth = .5)
ft <- theme_box(ft)
ft <- merge_h_range(ft, i = ~ cyl == 6, j1 = "am", j2 = "carb")
ft <- flextable::align(ft, i = ~ cyl == 6, align = "center")
ft
Delete flextable merging information
Description
Delete all merging information from a flextable.
Usage
merge_none(x, part = "all")
Arguments
x |
a 'flextable' object, see flextable-package to learn how to create 'flextable' object. |
part |
part selector, see section Part selection with the |
See Also
Other cell merging functions:
merge_at(),
merge_h(),
merge_h_range(),
merge_v()
Examples
typology <- data.frame(
  col_keys = c("Sepal.Length", "Sepal.Width", "Petal.Length", "Petal.Width", "Species"),
  what = c("Sepal", "Sepal", "Petal", "Petal", "Species"),
  measure = c("Length", "Width", "Length", "Width", "Species"),
  stringsAsFactors = FALSE
)

ft <- flextable(head(iris))
ft <- set_header_df(ft, mapping = typology, key = "col_keys")
ft <- merge_v(ft, j = c("Species"))

ft <- theme_tron_legacy(merge_none(ft))
ft
Merge flextable cells vertically
Description
Merge flextable cells vertically when consecutive cells have identical values. Text of formatted values are used to compare values if available.
Two options are available, either a column-by-column algorithm or an algorithm where the combinations of these columns are used once for all target columns.
Usage
merge_v(x, j = NULL, target = NULL, part = "body", combine = FALSE)
Arguments
x |
a 'flextable' object, see flextable-package to learn how to create 'flextable' object. |
j |
column selector, see section Column selection with the |
target |
columns names where cells have to be merged. |
part |
part selector, see section Part selection with the |
combine |
If the value is TRUE, the columns defined by |
See Also
Other cell merging functions:
merge_at(),
merge_h(),
merge_h_range(),
merge_none()
Examples
ft_merge <- flextable(mtcars)
ft_merge <- merge_v(ft_merge, j = c("gear", "carb"))
ft_merge

data_ex <- structure(list(srdr_id = c(
  "175124", "175124", "172525", "172525",
  "172545", "172545", "172609", "172609", "172609"
), substances = c(
  "alcohol",
  "alcohol", "alcohol", "alcohol", "cannabis",
  "cannabis", "alcohol\n cannabis\n other drugs",
  "alcohol\n cannabis\n other drugs",
  "alcohol\n cannabis\n other drugs"
), full_name = c(
  "TAU", "MI", "TAU", "MI (parent)", "TAU", "MI",
  "TAU", "MI", "MI"
), article_arm_name = c(
  "Control", "WISEteens",
  "Treatment as usual", "Brief MI (b-MI)", "Assessed control",
  "Intervention", "Control", "Computer BI", "Therapist BI"
)), row.names = c(
  NA,
  -9L
), class = c("tbl_df", "tbl", "data.frame"))


ft_1 <- flextable(data_ex)
ft_1 <- theme_box(ft_1)
ft_2 <- merge_v(ft_1,
  j = "srdr_id",
  target = c("srdr_id", "substances")
)
ft_2
Mini barplot chunk
Description
This function is used to insert bars into flextable with functions:
Usage
minibar(
  value,
  max = NULL,
  barcol = "#CCCCCC",
  bg = "transparent",
  width = 1,
  height = 0.2,
  unit = "in",
  alt = ""
)
Arguments
value |
values containing the bar size |
max |
max bar size |
barcol |
bar color |
bg |
background color |
width, height |
size of the resulting png file in inches |
unit |
unit for width and height, one of "in", "cm", "mm". |
alt |
alternative text for the image (used for accessibility) |
Note
This chunk option requires package officedown in a R Markdown
context with Word output format. With Quarto (format: docx) or
rmarkdown::word_document(), the resulting file must be repaired
with repair_docx().
PowerPoint cannot mix images and text in a paragraph, images are removed when outputing to PowerPoint format.
See Also
Other chunk elements for paragraph:
as_b(),
as_bracket(),
as_chunk(),
as_equation(),
as_highlight(),
as_i(),
as_image(),
as_qmd(),
as_strike(),
as_sub(),
as_sup(),
as_word_field(),
colorize(),
gg_chunk(),
grid_chunk(),
hyperlink_text(),
linerange(),
plot_chunk()
Examples
ft <- flextable(head(iris, n = 10))

ft <- compose(ft,
  j = 1,
  value = as_paragraph(
    minibar(value = Sepal.Length, max = max(Sepal.Length))
  ),
  part = "body"
)

ft <- autofit(ft)
ft
Number of columns
Description
returns the number of columns displayed
Usage
ncol_keys(x)
Arguments
x |
a 'flextable' object, see flextable-package to learn how to create 'flextable' object. |
See Also
Other functions for flextable size management:
autofit(),
dim.flextable(),
dim_pretty(),
fit_columns(),
fit_to_width(),
flextable_dim(),
height(),
hrule(),
nrow_part(),
set_table_properties(),
width()
Examples
library(flextable)
ft <- qflextable(head(cars))
ncol_keys(ft)
internal utils for roxygen tags reuse
Description
internal utils for roxygen tags reuse
Note
This chunk option requires package officedown in a R Markdown
context with Word output format. With Quarto (format: docx) or
rmarkdown::word_document(), the resulting file must be repaired
with repair_docx().
PowerPoint cannot mix images and text in a paragraph, images are removed when outputing to PowerPoint format.
Number of rows of a part
Description
returns the number of lines in a part of flextable.
Usage
nrow_part(x, part = "body")
Arguments
x |
a 'flextable' object, see flextable-package to learn how to create 'flextable' object. |
part |
part selector, see section Part selection with the |
See Also
Other functions for flextable size management:
autofit(),
dim.flextable(),
dim_pretty(),
fit_columns(),
fit_to_width(),
flextable_dim(),
height(),
hrule(),
ncol_keys(),
set_table_properties(),
width()
Examples
library(flextable)
ft <- qflextable(head(cars))
nrow_part(ft, part = "body")
Set paragraph paddings
Description
Change the padding of selected rows and columns of a flextable.
Usage
padding(
  x,
  i = NULL,
  j = NULL,
  padding = NULL,
  padding.top = NULL,
  padding.bottom = NULL,
  padding.left = NULL,
  padding.right = NULL,
  part = "body"
)
Arguments
x |
a 'flextable' object, see flextable-package to learn how to create 'flextable' object. |
i |
row selector, see section Row selection with the |
j |
column selector, see section Column selection with the |
padding |
padding (shortcut for top, bottom, left and right), unit is pts (points). |
padding.top |
padding top, unit is pts (points). |
padding.bottom |
padding bottom, unit is pts (points). |
padding.left |
padding left, unit is pts (points). |
padding.right |
padding right, unit is pts (points). |
part |
part selector, see section Part selection with the |
Note
In PDF output, only padding.left and padding.right are supported.
padding.top and padding.bottom are ignored due to LaTeX limitations.
Global horizontal spacing can also be set with
set_table_properties(opts_pdf = list(tabcolsep = 1)).
See Also
Other formatting shortcuts:
align(),
bg(),
bold(),
color(),
empty_blanks(),
font(),
fontsize(),
highlight(),
indentation(),
italic(),
keep_with_next(),
line_spacing(),
rotate(),
style(),
tab_settings(),
valign()
Examples
ft_1 <- flextable(head(iris))
ft_1 <- theme_vader(ft_1)
ft_1 <- padding(ft_1, padding.top = 4, part = "all")
ft_1 <- padding(ft_1, j = 1, padding.right = 40)
ft_1 <- padding(ft_1, i = 3, padding.top = 40)
ft_1 <- padding(ft_1, padding.top = 10, part = "header")
ft_1 <- padding(ft_1, padding.bottom = 10, part = "header")
ft_1 <- autofit(ft_1)
ft_1
Prevent page breaks inside a flextable
Description
Prevents breaks between tables rows you want to stay together. This feature only applies to Word and RTF output.
Usage
paginate(
  x,
  init = NULL,
  hdr_ftr = TRUE,
  group = character(),
  group_def = c("rle", "nonempty", "starts")
)
Arguments
x |
a 'flextable' object, see flextable-package to learn how to create 'flextable' object. |
init |
init value for keep_with_next property, it default
value is |
hdr_ftr |
if TRUE (default), prevent breaks between table body and header and between table body and footer. |
group |
name of a column to use for finding groups (when
|
group_def |
algorithm to be used to identify groups that should not be split into two pages, one of 'rle', 'nonempty', 'starts':
|
Details
The pagination of tables allows you to control their position in relation to page breaks.
For small tables, a simple setting is usually used that indicates that all rows should be displayed together:
paginate(x, init = TRUE, hdr_ftr = TRUE)
For large tables, it is recommended to use a setting that indicates that all rows of the header should be bound to the first row of the table to avoid the case where the header is displayed alone at the bottom of the page and then repeated on the next one:
paginate(x, init = FALSE, hdr_ftr = TRUE)
For tables that present groups that you don't want to be presented on two pages, you must use a parameterization involving the notion of group and an algorithm for determining the groups.
paginate(x, group = "grp", group_def = "rle")
Value
updated flextable object
See Also
Other row and column operations:
add_body(),
add_body_row(),
add_footer(),
add_footer_lines(),
add_footer_row(),
add_header(),
add_header_lines(),
add_header_row(),
delete_columns(),
delete_part(),
delete_rows(),
separate_header(),
set_header_footer_df,
set_header_labels(),
split_columns(),
split_rows(),
split_to_pages()
Examples
library(data.table)
library(flextable)

init_flextable_defaults()

multi_fun <- function(x) {
  list(mean = mean(x), sd = sd(x))
}

dat <- as.data.table(ggplot2::diamonds)
dat <- dat[clarity %in% c("I1", "SI1", "VS2")]

dat <- dat[, unlist(lapply(.SD, multi_fun),
  recursive = FALSE
),
.SDcols = c("z", "y"),
by = c("cut", "color", "clarity")
]

tab <- tabulator(
  x = dat, rows = c("cut", "color"),
  columns = "clarity",
  `z stats` = as_paragraph(as_chunk(fmt_avg_dev(z.mean, z.sd, digit2 = 2))),
  `y stats` = as_paragraph(as_chunk(fmt_avg_dev(y.mean, y.sd, digit2 = 2)))
)

ft_1 <- as_flextable(tab)
ft_1 <- autofit(x = ft_1, add_w = .05)
ft_1 <- paginate(ft_1, group = "cut", group_def = "rle")

save_as_docx(ft_1, path = tempfile(fileext = ".docx"))
save_as_rtf(ft_1, path = tempfile(fileext = ".rtf"))
Add a flextable into a PowerPoint slide
Description
Add a flextable in a PowerPoint document object produced
by officer::read_pptx().
This function will create a native PowerPoint table from the flextable and the result can be eventually edited.
Usage
## S3 method for class 'flextable'
ph_with(x, value, location, ...)
Arguments
x |
a pptx device |
value |
flextable object |
location |
a location for a placeholder. See |
... |
unused arguments. |
caption
Captions are not printed in PowerPoint slides.
While captions are useful for document formats like Word, RTF, HTML, or PDF, they aren't directly supported in PowerPoint slides. Unlike documents with a defined layout, PowerPoint slides lack a structured document flow. They don't function like HTML documents or paginated formats (RTF, Word, PDF). This makes it technically challenging to determine the ideal placement for a caption within a slide. Additionally, including a caption within the table itself isn't feasible.
Note
The width and height of the table can not be set with location. Use
functions width(), height(), autofit()
and dim_pretty() instead. The overall size is resulting from
cells, paragraphs and text properties (i.e. padding, font size, border widths).
See Also
Other functions for officer integration:
body_add_flextable(),
body_replace_flextable_at_bkm(),
rtf_add.flextable()
Examples
library(officer)

ft <- flextable(head(iris))

doc <- read_pptx()
doc <- add_slide(doc, "Title and Content", "Office Theme")
doc <- ph_with(doc, ft, location = ph_location_left())

fileout <- tempfile(fileext = ".pptx")
print(doc, target = fileout)
Plot a flextable
Description
plots a flextable as a grid grob object and display the result in a new graphics window. 'ragg' or 'svglite' or 'ggiraph' graphical device drivers should be used to ensure a correct rendering.
Usage
## S3 method for class 'flextable'
plot(x, ...)
Arguments
x |
a 'flextable' object, see flextable-package to learn how to create 'flextable' object. |
... |
additional arguments passed to |
caption
It's important to note that captions are not part of the table itself. This means when exporting a table to PNG or SVG formats (image formats), the caption won't be included. Captions are intended for document outputs like Word, HTML, or PDF, where tables are embedded within the document itself.
See Also
Other functions for flextable output and export:
df_printer(),
flextable_to_rmd(),
gen_grob(),
htmltools_value(),
knit_print.flextable(),
print.flextable(),
repair_docx(),
save_as_docx(),
save_as_html(),
save_as_image(),
save_as_pptx(),
save_as_rtf(),
to_html.flextable(),
wrap_flextable()
Examples
library(gdtools)
library(ragg)
register_liberationsans()
set_flextable_defaults(font.family = "Liberation Sans")
ftab <- as_flextable(cars)


plot(ftab)
plot a flextable grob
Description
plot a flextable grob
Usage
## S3 method for class 'flextableGrob'
plot(x, ...)
Arguments
x |
a flextableGrob object |
... |
additional arguments passed to other functions |
Mini plot chunk
Description
This function is used to insert mini plots into flextable with functions:
Available plots are 'box', 'line', 'points', 'density'.
Usage
plot_chunk(
  value,
  width = 1,
  height = 0.2,
  type = "box",
  free_scale = FALSE,
  unit = "in",
  alt = "",
  ...
)
Arguments
value |
a numeric vector, stored in a list column. |
width, height |
size of the resulting png file in inches |
type |
type of the plot: 'box', 'line', 'points' or 'density'. |
free_scale |
Should scales be free (TRUE or FALSE, the default value). |
unit |
unit for width and height, one of "in", "cm", "mm". |
alt |
alternative text for the image (used for accessibility) |
... |
arguments sent to plot functions (see |
Note
This chunk option requires package officedown in a R Markdown
context with Word output format. With Quarto (format: docx) or
rmarkdown::word_document(), the resulting file must be repaired
with repair_docx().
PowerPoint cannot mix images and text in a paragraph, images are removed when outputing to PowerPoint format.
See Also
Other chunk elements for paragraph:
as_b(),
as_bracket(),
as_chunk(),
as_equation(),
as_highlight(),
as_i(),
as_image(),
as_qmd(),
as_strike(),
as_sub(),
as_sup(),
as_word_field(),
colorize(),
gg_chunk(),
grid_chunk(),
hyperlink_text(),
linerange(),
minibar()
Examples
library(data.table)
library(flextable)

z <- as.data.table(iris)
z <- z[, list(
  Sepal.Length = mean(Sepal.Length, na.rm = TRUE),
  z = list(.SD$Sepal.Length)
), by = "Species"]

ft <- flextable(z,
  col_keys = c("Species", "Sepal.Length", "box", "density")
)
ft <- mk_par(ft, j = "box", value = as_paragraph(
  plot_chunk(
    value = z, type = "box",
    border = "red", col = "transparent"
  )
))
ft <- mk_par(ft, j = "density", value = as_paragraph(
  plot_chunk(value = z, type = "dens", col = "red")
))
ft <- set_table_properties(ft, layout = "autofit", width = .6)
ft <- set_header_labels(ft, box = "boxplot", density = "density")
theme_vanilla(ft)
Prepend chunks to flextable content
Description
prepend chunks (for example chunk as_chunk())
in a flextable.
Usage
prepend_chunks(x, ..., i = NULL, j = NULL, part = "body")
Arguments
x |
a 'flextable' object, see flextable-package to learn how to create 'flextable' object. |
... |
chunks to be prepended, see |
i |
row selector, see section Row selection with the |
j |
column selector, see section Column selection with the |
part |
part selector, see section Part selection with the |
See Also
Other functions to compose cell content:
append_chunks(),
as_paragraph(),
compose(),
footnote(),
labelizor(),
void()
Examples
x <- flextable(head(iris))
x <- prepend_chunks(
  x,
  i = 1, j = 1,
  colorize(as_b("Hello "), color = "red"),
  colorize(as_i("World"), color = "magenta")
)
x
Print a flextable
Description
print a flextable object to format html, docx,
pptx or as text (not for display but for informative purpose).
This function is to be used in an interactive context.
Usage
## S3 method for class 'flextable'
print(x, preview = "html", align = "center", ...)
Arguments
x |
a 'flextable' object, see flextable-package to learn how to create 'flextable' object. |
preview |
preview type, one of c("html", "pptx", "docx", "rtf", "pdf, "log").
When |
align |
left, center (default) or right. Only for docx/html/pdf. |
... |
arguments for 'pdf_document' call when preview is "pdf". |
Note
When argument preview is set to "docx" or "pptx", an
external client linked to these formats (Office is installed) is used to
edit a document. The document is saved in the temporary directory of
the R session and will be removed when R session will be ended.
When argument preview is set to "html", an
external client linked to these HTML format is used to display the table.
If RStudio is used, the Viewer is used to display the table.
Note also that a print method is used when flextable are used within
R markdown documents. See knit_print.flextable().
See Also
Other functions for flextable output and export:
df_printer(),
flextable_to_rmd(),
gen_grob(),
htmltools_value(),
knit_print.flextable(),
plot.flextable(),
repair_docx(),
save_as_docx(),
save_as_html(),
save_as_image(),
save_as_pptx(),
save_as_rtf(),
to_html.flextable(),
wrap_flextable()
Frequency table
Description
This function computes a one or two way contingency table and creates a flextable from the result.
The function is largely inspired by "PROC FREQ" from "SAS" and was written with the intent to make it as compact as possible.
Usage
proc_freq(
  x,
  row = character(),
  col = character(),
  include.row_percent = TRUE,
  include.column_percent = TRUE,
  include.table_percent = TRUE,
  include.table_count = TRUE,
  weight = character(),
  count_format_fun = fmt_int,
  ...
)
Arguments
x |
a |
row |
|
col |
|
include.row_percent |
|
include.column_percent |
|
include.table_percent |
|
include.table_count |
|
weight |
|
count_format_fun |
a function to format the count values, defaults to fmt_int. |
... |
unused arguments |
Examples
proc_freq(mtcars, "vs", "gear")
proc_freq(mtcars, "gear", "vs", weight = "wt")
flextable old functions
Description
The function is maintained for compatibility with old codes
mades by users but be aware it produces the same exact object than flextable().
This function should be deprecated then removed in the next versions.
Usage
regulartable(data, col_keys = names(data), cwidth = 0.75, cheight = 0.25)
Arguments
data |
dataset |
col_keys |
columns names/keys to display. If some column names are not in the dataset, they will be added as blank columns by default. |
cwidth, cheight |
initial width and height to use for cell sizes in inches. |
Repair flextables in a 'Word' document produced by 'pandoc'
Description
Word documents produced by Quarto (format: docx) or by
rmarkdown::word_document() are written by 'pandoc', which copies the
raw OOXML of flextable objects verbatim: images and hyperlinks are
left as unresolved references (file paths and URLs instead of
relationship identifiers) and Word refuses to open the file.
This function reads such a document and rewrites it with the package
'officer', whose writer resolves these references: images and SVG
files are embedded, hyperlinks are registered, and the other
officer-flavored contents are processed as well (sections, footnotes,
comments, custom style names, list markers, documents poured with
officer::block_pour_docx()).
It is not needed when the document is produced with
officedown::rdocx_document() or save_as_docx(), where the file is
already written by 'officer'.
Usage
repair_docx(path, target = path)
Arguments
path |
path of the 'docx' file to repair. The file is modified
in place unless |
target |
path of the resulting 'docx' file. Defaults to |
Value
the path of the repaired file, invisibly.
What to do with Quarto
The repair must run after quarto render. Quarto can do it for you
with a post-render script, but this can only be declared in a
_quarto.yml file - the project: key is ignored in the YAML header
of a .qmd file.
Next to your
.qmdfile, create a file_quarto.ymlcontaining:
project:
  post-render: repair.R
In the same directory, create the file
repair.Rcontaining:
files <- strsplit(Sys.getenv("QUARTO_PROJECT_OUTPUT_FILES"), "\n")[[1]]
for (f in files[grepl("\\.docx$", files, ignore.case = TRUE)]) {
  flextable::repair_docx(f)
}
Render as usual, either the whole project (
quarto render) or a single file (quarto render doc.qmd); the script runs in both cases and only processes the files that were rendered.
Without a _quarto.yml, call repair_docx("doc.docx") manually
after each render.
What to do with R Markdown
Prefer officedown::rdocx_document() as output format: the file is
post-processed by 'officer' and no repair is needed. With
rmarkdown::word_document(), call
repair_docx() on the output file after rmarkdown::render().
Requirements and limits
The images referenced in the document must still exist, at paths resolvable from the directory where
repair_docx()runs: a Quarto post-render script runs at the project root, so images referenced with paths relative to a sub-directory document will not be found - use absolute paths (e.g.here::here()) in that case.Mini graphics generated by
minibar(),linerange(),gg_chunk(),plot_chunk()andgrid_chunk()are written to temporary 'PNG' files that no longer exist once rendering has completed: these can not be repaired afterwards. With Quarto orrmarkdown::word_document(), use image files you manage yourself (as_image(),colformat_image()); mini graphics requireofficedown::rdocx_document()orsave_as_docx().When a referenced image can not be found, the rewrite fails with an error
cannot open the connectionand a warning naming the missing file.
See Also
Other functions for flextable output and export:
df_printer(),
flextable_to_rmd(),
gen_grob(),
htmltools_value(),
knit_print.flextable(),
plot.flextable(),
print.flextable(),
save_as_docx(),
save_as_html(),
save_as_image(),
save_as_pptx(),
save_as_rtf(),
to_html.flextable(),
wrap_flextable()
Examples
## Not run:
repair_docx("document.docx")

## End(Not run)
Rotate cell text
Description
It can be useful to change the text direction when table headers are large. For example, header labels can be rendered as "tbrl" (top to bottom and right to left), corresponding to a 90-degree rotation, or "btlr", corresponding to a 270-degree rotation. This function changes cell text direction. By default, it is "lrtb", which means from left to right and top to bottom.
'Word' and 'PowerPoint' do not handle automatic height with rotated headers.
Therefore, you need to set header heights (with the height() function)
and set the rule to "exact" for row heights (with the hrule() function);
otherwise, Word and PowerPoint outputs will have insufficient height
to properly display the text.
flextable does not rotate text by arbitrary angles. It only rotates by right angles (90-degree increments). This choice ensures consistent rendering across Word, PowerPoint (limited to angles 0, 270, and 90), HTML, and PDF.
Usage
rotate(x, i = NULL, j = NULL, rotation, align = NULL, part = "body")
Arguments
x |
a 'flextable' object, see flextable-package to learn how to create 'flextable' object. |
i |
row selector, see section Row selection with the |
j |
column selector, see section Column selection with the |
rotation |
one of "lrtb", "tbrl", "btlr". |
align |
vertical alignment of paragraph within cell, one of "center" or "top" or "bottom". |
part |
part selector, see section Part selection with the |
Details
When the autofit() function is used, rotation will be
ignored. In that case, use dim_pretty and width instead
of autofit().
See Also
Other formatting shortcuts:
align(),
bg(),
bold(),
color(),
empty_blanks(),
font(),
fontsize(),
highlight(),
indentation(),
italic(),
keep_with_next(),
line_spacing(),
padding(),
style(),
tab_settings(),
valign()
Examples
library(flextable)

ft_1 <- flextable(head(iris))

ft_1 <- rotate(ft_1, j = 1:4, align = "bottom", rotation = "tbrl", part = "header")
ft_1 <- rotate(ft_1, j = 5, align = "bottom", rotation = "btlr", part = "header")

# if output is docx or pptx, think about (1) set header heights
# and (2) set rule "exact" for rows heights because Word
# and PowerPoint don't handle auto height with rotated headers
ft_1 <- height(ft_1, height = 1.2, part = "header")
ft_1 <- hrule(ft_1, i = 1, rule = "exact", part = "header")

ft_1

dat <- data.frame(
  a = c("left-top", "left-middle", "left-bottom"),
  b = c("center-top", "center-middle", "center-bottom"),
  c = c("right-top", "right-middle", "right-bottom")
)

ft_2 <- flextable(dat)
ft_2 <- theme_box(ft_2)
ft_2 <- height_all(x = ft_2, height = 1.3, part = "body")
ft_2 <- hrule(ft_2, rule = "exact")
ft_2 <- rotate(ft_2, rotation = "tbrl")
ft_2 <- width(ft_2, width = 1.3)

ft_2 <- align(ft_2, j = 1, align = "left")
ft_2 <- align(ft_2, j = 2, align = "center")
ft_2 <- align(ft_2, j = 3, align = "right")

ft_2 <- valign(ft_2, i = 1, valign = "top")
ft_2 <- valign(ft_2, i = 2, valign = "center")
ft_2 <- valign(ft_2, i = 3, valign = "bottom")

ft_2
Add a 'flextable' into an RTF document
Description
officer::rtf_add() method for adding
flextable objects into 'RTF' documents.
Usage
## S3 method for class 'flextable'
rtf_add(x, value, ...)
Arguments
x |
rtf object, created by |
value |
a flextable object |
... |
unused arguments |
See Also
Other functions for officer integration:
body_add_flextable(),
body_replace_flextable_at_bkm(),
ph_with.flextable()
Examples
library(flextable)
library(officer)

ft <- flextable(head(iris))
ft <- autofit(ft)

z <- rtf_doc()
z <- rtf_add(z, ft)

print(z, target = tempfile(fileext = ".rtf"))
Save flextable objects in a 'Word' file
Description
sugar function to save flextable objects in an Word file.
Usage
save_as_docx(..., values = NULL, path, pr_section = NULL, align = "center")
Arguments
... |
flextable objects, objects, possibly named. If named objects, names are used as titles. |
values |
a list (possibly named), each element is a flextable object. If named objects, names are
used as titles. If provided, argument |
path |
Word file to be created |
pr_section |
a officer::prop_section object that can be used to define page layout such as orientation, width and height. |
align |
left, center (default) or right. |
Value
a string containing the full name of the generated file
See Also
Other functions for flextable output and export:
df_printer(),
flextable_to_rmd(),
gen_grob(),
htmltools_value(),
knit_print.flextable(),
plot.flextable(),
print.flextable(),
repair_docx(),
save_as_html(),
save_as_image(),
save_as_pptx(),
save_as_rtf(),
to_html.flextable(),
wrap_flextable()
Examples
tf <- tempfile(fileext = ".docx")

library(officer)
ft1 <- flextable(head(iris))
save_as_docx(ft1, path = tf)


ft2 <- flextable(head(mtcars))
sect_properties <- prop_section(
  page_size = page_size(
    orient = "landscape",
    width = 8.3, height = 11.7
  ),
  type = "continuous",
  page_margins = page_mar()
)
save_as_docx(
  `iris table` = ft1, `mtcars table` = ft2,
  path = tf, pr_section = sect_properties
)
Save flextable objects in an 'HTML' file
Description
save a flextable in an 'HTML' file. This function is useful to save the flextable in 'HTML' file without using R Markdown (it is highly recommanded to use R Markdown instead).
Usage
save_as_html(..., values = NULL, path, lang = "en", title = " ")
Arguments
... |
flextable objects, objects, possibly named. If named objects, names are used as titles. |
values |
a list (possibly named), each element is a flextable object. If named objects, names are
used as titles. If provided, argument |
path |
HTML file to be created |
lang |
language of the document using IETF language tags |
title |
page title |
Value
a string containing the full name of the generated file
See Also
Other functions for flextable output and export:
df_printer(),
flextable_to_rmd(),
gen_grob(),
htmltools_value(),
knit_print.flextable(),
plot.flextable(),
print.flextable(),
repair_docx(),
save_as_docx(),
save_as_image(),
save_as_pptx(),
save_as_rtf(),
to_html.flextable(),
wrap_flextable()
Examples
ft1 <- flextable(head(iris))
tf1 <- tempfile(fileext = ".html")
if (rmarkdown::pandoc_available()) {
save_as_html(ft1, path = tf1)
# browseURL(tf1)
}
ft2 <- flextable(head(mtcars))
tf2 <- tempfile(fileext = ".html")
if (rmarkdown::pandoc_available()) {
save_as_html(
`iris table` = ft1,
`mtcars table` = ft2,
path = tf2,
title = "rhoooo"
)
# browseURL(tf2)
}
Save a flextable in a 'png' or 'svg' file
Description
Save a flextable as a png or svg image.
This function uses R graphic system to create an image from the flextable,
allowing for high-quality image output. See gen_grob() for more options.
Usage
save_as_image(x, path, expand = 10, res = 200, ...)
Arguments
x |
a 'flextable' object, see flextable-package to learn how to create 'flextable' object. |
path |
image file to be created. It should end with '.png' or '.svg'. |
expand |
space in pixels to add around the table. |
res |
The resolution of the device |
... |
unused arguments |
Value
a string containing the full name of the generated file
caption
It's important to note that captions are not part of the table itself. This means when exporting a table to PNG or SVG formats (image formats), the caption won't be included. Captions are intended for document outputs like Word, HTML, or PDF, where tables are embedded within the document itself.
See Also
Other functions for flextable output and export:
df_printer(),
flextable_to_rmd(),
gen_grob(),
htmltools_value(),
knit_print.flextable(),
plot.flextable(),
print.flextable(),
repair_docx(),
save_as_docx(),
save_as_html(),
save_as_pptx(),
save_as_rtf(),
to_html.flextable(),
wrap_flextable()
Examples
library(gdtools)
register_liberationsans()
set_flextable_defaults(font.family = "Liberation Sans")
ft <- flextable(head(mtcars))
ft <- autofit(ft)
tf <- tempfile(fileext = ".png")
save_as_image(x = ft, path = tf)
init_flextable_defaults()
Save flextable objects in a 'PowerPoint' file
Description
sugar function to save flextable objects in an PowerPoint file.
This feature is available to simplify the work of users by avoiding the need to use the 'officer' package. If it doesn't suit your needs, then use the API offered by 'officer' which allows simple and complicated things.
Usage
save_as_pptx(..., values = NULL, path)
Arguments
... |
flextable objects, objects, possibly named. If named objects, names are used as slide titles. |
values |
a list (possibly named), each element is a flextable object. If named objects, names are
used as slide titles. If provided, argument |
path |
PowerPoint file to be created |
Value
a string containing the full name of the generated file
Note
The PowerPoint format ignores captions (see set_caption()).
See Also
Other functions for flextable output and export:
df_printer(),
flextable_to_rmd(),
gen_grob(),
htmltools_value(),
knit_print.flextable(),
plot.flextable(),
print.flextable(),
repair_docx(),
save_as_docx(),
save_as_html(),
save_as_image(),
save_as_rtf(),
to_html.flextable(),
wrap_flextable()
Examples
ft1 <- flextable(head(iris))
tf <- tempfile(fileext = ".pptx")
save_as_pptx(ft1, path = tf)
ft2 <- flextable(head(mtcars))
tf <- tempfile(fileext = ".pptx")
save_as_pptx(`iris table` = ft1, `mtcars table` = ft2, path = tf)
Save flextable objects in an 'RTF' file
Description
sugar function to save flextable objects in an 'RTF' file.
Usage
save_as_rtf(..., values = NULL, path, pr_section = NULL)
Arguments
... |
flextable objects, objects, possibly named. If named objects, names are used as titles. |
values |
a list (possibly named), each element is a flextable object. If named objects, names are
used as titles. If provided, argument |
path |
Word file to be created |
pr_section |
a officer::prop_section object that can be used to define page layout such as orientation, width and height. |
Value
a string containing the full name of the generated file
See Also
Other functions for flextable output and export:
df_printer(),
flextable_to_rmd(),
gen_grob(),
htmltools_value(),
knit_print.flextable(),
plot.flextable(),
print.flextable(),
repair_docx(),
save_as_docx(),
save_as_html(),
save_as_image(),
save_as_pptx(),
to_html.flextable(),
wrap_flextable()
Examples
tf <- tempfile(fileext = ".rtf")
library(officer)
ft1 <- flextable(head(iris))
save_as_rtf(ft1, path = tf)
ft2 <- flextable(head(mtcars))
sect_properties <- prop_section(
page_size = page_size(
orient = "landscape",
width = 8.3, height = 11.7
),
type = "continuous",
page_margins = page_mar(),
header_default = block_list(
fpar(ftext("text for default page header")),
qflextable(data.frame(a = 1L))
)
)
tf <- tempfile(fileext = ".rtf")
save_as_rtf(
`iris table` = ft1, `mtcars table` = ft2,
path = tf, pr_section = sect_properties
)
Save flextable objects in a Typst file
Description
Writes one or more flextables to a standalone Typst
(.typ) document. Images are embedded as base64 (decoded inline at
compile time), so the file is self-contained and compiles offline with
typst compile. Equations require the mitex Typst package, which is
fetched from the Typst package registry on first compilation.
Usage
save_as_typst(
...,
values = NULL,
path,
page = "#set page(width: auto, height: auto, margin: 12pt)"
)
Arguments
... |
flextable objects, possibly named. |
values |
a list of flextable objects. If provided, |
path |
Typst file to be created. |
page |
a Typst |
Value
the path to the generated file, invisibly.
Examples
ft <- flextable(head(iris))
tf <- tempfile(fileext = ".typ")
save_as_typst(ft, path = tf)
Split column names using a separator into multiple rows
Description
This function is used to separate and place individual
labels in their own rows if your variable names contain multiple
delimited labels.
Usage
separate_header(
x,
opts = c("span-top", "center-hspan", "bottom-vspan", "default-theme"),
split = "[_\\.]",
fixed = FALSE
)
Arguments
x |
a 'flextable' object, see flextable-package to learn how to create 'flextable' object. |
opts |
Optional treatments to apply to the resulting header part. This should be a character vector with support for multiple values. Supported values include:
|
split |
a regular expression (unless |
fixed |
logical. If TRUE match |
See Also
Other row and column operations:
add_body(),
add_body_row(),
add_footer(),
add_footer_lines(),
add_footer_row(),
add_header(),
add_header_lines(),
add_header_row(),
delete_columns(),
delete_part(),
delete_rows(),
paginate(),
set_header_footer_df,
set_header_labels(),
split_columns(),
split_rows(),
split_to_pages()
Examples
library(flextable)
x <- data.frame(
Species = as.factor(c("setosa", "versicolor", "virginica")),
Sepal.Length_mean = c(5.006, 5.936, 6.588),
Sepal.Length_sd = c(0.35249, 0.51617, 0.63588),
Sepal.Width_mean = c(3.428, 2.77, 2.974),
Sepal.Width_sd = c(0.37906, 0.3138, 0.3225),
Petal.Length_mean = c(1.462, 4.26, 5.552),
Petal.Length_sd = c(0.17366, 0.46991, 0.55189),
Petal.Width_mean = c(0.246, 1.326, 2.026),
Petal.Width_sd = c(0.10539, 0.19775, 0.27465)
)
ft_1 <- flextable(x)
ft_1 <- colformat_double(ft_1, digits = 2)
ft_1 <- theme_box(ft_1)
ft_1 <- separate_header(
x = ft_1,
opts = c("span-top", "bottom-vspan")
)
ft_1
Set flextable caption
Description
Set caption value in a flextable. The function can also be used to define formattings that will be applied if possible to Word and HTML outputs.
The caption will be associated with a paragraph style when the output is Word. It can also be numbered as a auto-numbered Word computed value.
The PowerPoint format ignores captions. PowerPoint documents are not structured and do not behave as HTML documents and paginated documents (word, pdf), and it's not possible to know where we should create a shape to contain the caption (technically it can't be in the PowerPoint shape containing the table).
When working with 'R Markdown' or 'Quarto', the caption settings
defined with set_caption() will be prioritized over knitr chunk options.
Caption value can be a single string or the result to a call to
as_paragraph(). With the latter, the caption is made of
formatted chunks whereas with the former, caption will not be
associated with any formatting.
Usage
set_caption(
x,
caption = NULL,
autonum = NULL,
word_stylename = "Table Caption",
style = word_stylename,
fp_p = fp_par(padding = 3),
align_with_table = TRUE,
html_classes = NULL,
html_escape = TRUE
)
Arguments
x |
a 'flextable' object, see flextable-package to learn how to create 'flextable' object. |
caption |
caption value. The caption can be either a string either
a call to Caption as a string does not support 'Markdown' syntax. If you want to
add a bold text in the caption, use |
autonum |
an autonum representation. See |
word_stylename, style |
'Word' style name to associate with caption paragraph. These names are available with
function |
fp_p |
paragraph formatting properties associated with the caption, see |
align_with_table |
if TRUE, caption is aligned as the flextable, if FALSE,
|
html_classes |
css class(es) to apply to associate with caption paragraph when output is 'Word'. |
html_escape |
should HTML entities be escaped so that it can be safely included as text or an attribute value within an HTML document. |
Details
The behavior of captions in the 'flextable' package varies depending on the formats and technologies used.
The values set by the set_caption() function will be prioritized whenever
possible, including the caption ID and associated paragraph style.
However, it's important to note that the behavior may differ across different tools.
Here's what we have observed and attempted to respect, but please inform us
if you believe our observations are incorrect:
In Word and HTML documents created with 'rmarkdown'
rmarkdown::word_document()andrmarkdown::html_document(), numbered and cross-referenced captions are not typically expected.In PDF documents created with 'rmarkdown'
rmarkdown::pdf_document(), numbers are automatically added before the caption.In Word and HTML documents created with 'bookdown', numbered and cross-referenced captions are expected. 'bookdown' handles this functionality, but due to technical reasons, the caption should not be defined within an HTML or XML block. Therefore, when using 'flextable', the ability to format the caption content is lost (this limitation does not apply to PDF documents).
HTML and PDF documents created with Quarto handle captions and cross-references differently. Quarto replaces captions with 'tbl-cap' and 'label' values.
Word documents created with Quarto present another specific case. Currently, Quarto does not inject captions using the 'tbl-cap' and label values. However, this is a temporary situation that is expected to change in the future. The 'flextable' package will adapt accordingly as Quarto evolves.
When using the
body_add_flextable()function, all the options specified withset_caption()will be enabled.
Using body_add_flextable() enable all options specified with set_caption().
R Markdown
flextable captions can be defined from R Markdown documents by using
knitr::opts_chunk$set(). User don't always have to call set_caption()
to set a caption, he can use knitr chunk options instead. A typical call
would be:
```{r}
#| tab.id: bookmark_id
#| tab.cap: caption text
flextable(head(cars))
```
tab.id is the caption id or bookmark, tab.cap is the caption
text. There are many options that can replace set_caption()
features. The following knitr chunk options are available:
| label | name | value |
| Word stylename to use for table captions. | tab.cap.style | NULL |
| caption id/bookmark | tab.id | NULL |
| caption | tab.cap | NULL |
| display table caption on top of the table or not | tab.topcaption | TRUE |
| caption table sequence identifier. | tab.lp | "tab:" |
| prefix for numbering chunk (default to "Table "). | tab.cap.pre | Table |
| suffix for numbering chunk (default to ": "). | tab.cap.sep | " :" |
| title number depth | tab.cap.tnd | 0 |
| separator to use between title number and table number. | tab.cap.tns | "-" |
| caption prefix formatting properties | tab.cap.fp_text | fp_text_lite(bold = TRUE) |
See knit_print.flextable for more details.
Formatting the caption
To create captions in R Markdown using the 'flextable' package and 'officer'
package, you can utilize the as_paragraph() function. This approach is
recommended when your captions require complex content, such as a combination of
different text styles or the inclusion of images and equations.
The caption is constructed as a paragraph consisting of multiple chunks. Each chunk represents a specific portion of the caption with its desired formatting, such as red bold text or Arial italic text.
By default, if no specific formatting is specified (using either "a string" or
as_chunk("a string")), the fp_text_default() function sets the font settings
for the caption, including the font family, boldness, italics, color, etc. The
default values can be modified using the set_flextable_defaults() function.
However, it is recommended to explicitly use as_chunk() to define the desired
formatting.
It's important to note that the style properties of the caption will not override the formatting of the individual elements within it. Therefore, you need to explicitly specify the font to be used for the caption.
Here's an example of how to set a caption for a flextable in R Markdown using the 'officer' package:
library(flextable)
library(officer)
ftab <- flextable(head(cars)) %>%
set_caption(
as_paragraph(
as_chunk("caption", props = fp_text_default(font.family = "Cambria"))
), word_stylename = "Table Caption"
)
print(ftab, preview = "docx")
In this example, the set_caption() function sets the caption for the
flextable. The caption is created using as_paragraph() with a single chunk
created using as_chunk("caption", props = fp_text_default(font.family = "Cambria")). The word_stylename parameter is used to specify the table
caption style in the resulting Word document. Finally, the print() function
generates the flextable with the caption, and preview = "docx" displays a
preview of the resulting Word document.
Using 'Quarto'
In 'Quarto', captions and cross-references are handled differently
compared to 'R Markdown', where flextable takes care of the job.
In Quarto, the responsibility for managing captions lies with the Quarto
framework itself. Consequently, the set_caption() function in 'flextable'
is not as useful in a 'Quarto' document. The formatting and numbering of
captions are determined by Quarto rather than flextable. Please refer to
the Quarto documentation for more information on how to work with captions
in Quarto.
See Also
flextable(), knit_print.flextable()
Examples
ftab <- flextable(head(iris))
ftab <- set_caption(ftab, "my caption")
ftab
library(officer)
autonum <- run_autonum(seq_id = "tab", bkm = "mtcars")
ftab <- flextable(head(mtcars))
ftab <- set_caption(ftab, caption = "mtcars data", autonum = autonum)
ftab
Modify flextable defaults formatting properties
Description
The current formatting properties (see get_flextable_defaults())
are automatically applied to every flextable you produce.
Use set_flextable_defaults() to override them. Use init_flextable_defaults()
to re-init all values with the package defaults.
Usage
set_flextable_defaults(
font.family = NULL,
font.size = NULL,
font.color = NULL,
text.align = NULL,
padding = NULL,
padding.bottom = NULL,
padding.top = NULL,
padding.left = NULL,
padding.right = NULL,
border.color = NULL,
border.width = NULL,
background.color = NULL,
line_spacing = NULL,
table.layout = NULL,
cs.family = NULL,
eastasia.family = NULL,
hansi.family = NULL,
decimal.mark = NULL,
big.mark = NULL,
digits = NULL,
pct_digits = NULL,
na_str = NULL,
nan_str = NULL,
fmt_date = NULL,
fmt_datetime = NULL,
extra_css = NULL,
scroll = NULL,
table_align = "center",
split = NULL,
keep_with_next = NULL,
tabcolsep = NULL,
arraystretch = NULL,
float = NULL,
fonts_ignore = NULL,
theme_fun = NULL,
post_process_all = NULL,
post_process_pdf = NULL,
post_process_docx = NULL,
post_process_html = NULL,
post_process_pptx = NULL,
...
)
init_flextable_defaults()
Arguments
font.family |
single character value. When format is Word, it specifies the font to
be used to format characters in the Unicode range (U+0000-U+007F). If you
want to use non ascii characters in Word, you should also set |
font.size |
font size (in point) - 0 or positive integer value. |
font.color |
font color - a single character value specifying a valid color (e.g. "#000000" or "black"). |
text.align |
text alignment - a single character value, expected value is one of 'left', 'right', 'center', 'justify'. |
padding |
padding (shortcut for top, bottom, left and right padding) |
padding.bottom, padding.top, padding.left, padding.right |
paragraph paddings - 0 or positive integer value. |
border.color |
border color - single character value (e.g. "#000000" or "black"). |
border.width |
border width in points. |
background.color |
cell background color - a single character value specifying a valid color (e.g. "#000000" or "black"). |
line_spacing |
space between lines of text, 1 is single line spacing, 2 is double line spacing. |
table.layout |
'autofit' or 'fixed' algorithm. Default to 'autofit'. |
cs.family |
optional and only for Word. Font to be used to format characters in a complex script Unicode range. For example, Arabic text might be displayed using the "Arial Unicode MS" font. |
eastasia.family |
optional and only for Word. Font to be used to format characters in an East Asian Unicode range. For example, Japanese text might be displayed using the "MS Mincho" font. |
hansi.family |
optional and only for Word. Font to be used to format characters in a Unicode range which does not fall into one of the other categories. |
decimal.mark, big.mark, na_str, nan_str |
formatC arguments used by |
digits |
formatC argument used by |
pct_digits |
number of digits for percentages. |
fmt_date, fmt_datetime |
formats for date and datetime columns as
documented in |
extra_css |
css instructions to be integrated with the table. |
scroll |
NULL or a list if you want to add a scroll-box.
See scroll element of argument |
table_align |
default flextable alignment, supported values are 'left', 'center' and 'right'. |
split |
Word option 'Allow row to break across pages' can be activated when TRUE. |
keep_with_next |
default initialization value used by the |
tabcolsep |
space between the text and the left/right border of its containing cell. |
arraystretch |
height of each row relative to its default height, the default value is 1.5. |
float |
type of floating placement in the PDF document, one of:
|
fonts_ignore |
if TRUE, pdf-engine pdflatex can be used instead of xelatex or lualatex. If pdflatex is used, fonts will be ignored because they are not supported by pdflatex, whereas with the xelatex and lualatex engines they are. |
theme_fun |
a single character value (the name of the theme function to be applied) or a theme function (input is a flextable, output is a flextable). |
post_process_all |
Post-processing function that will allow you to customize the the table. It will be executed before call to post_process_pdf(), post_process_docx(), post_process_html(), post_process_pptx(). |
post_process_pdf, post_process_docx, post_process_html, post_process_pptx |
Post-processing functions that will allow you to customize the display by output type (pdf, html, docx, pptx). They are executed just before printing the table. |
... |
unused or deprecated arguments |
Value
a list containing previous default values.
See Also
Other themes and defaults:
get_flextable_defaults(),
theme_alafoli(),
theme_apa(),
theme_booktabs(),
theme_borderless(),
theme_box(),
theme_tron(),
theme_tron_legacy(),
theme_vader(),
theme_vanilla(),
theme_zebra()
Examples
ft_1 <- qflextable(head(airquality))
ft_1
old <- set_flextable_defaults(
font.color = "#AA8855",
border.color = "#8855AA"
)
ft_2 <- qflextable(head(airquality))
ft_2
do.call(set_flextable_defaults, old)
Set column formatter functions
Description
Apply formatter functions to column keys.
Functions should have a single argument (the vector) and should return the formatted values as a character vector.
Usage
set_formatter(x, ..., values = NULL, part = "body")
Arguments
x |
a 'flextable' object, see flextable-package to learn how to create 'flextable' object. |
... |
Name-value pairs of functions, names should be existing col_key values |
values |
format functions, If values is supplied argument
|
part |
part selector, see section Part selection with the |
See Also
Other cells formatters:
colformat_char(),
colformat_date(),
colformat_datetime(),
colformat_double(),
colformat_image(),
colformat_int(),
colformat_lgl(),
colformat_num()
Examples
ft <- flextable(head(iris))
ft <- set_formatter(
x = ft,
Sepal.Length = function(x) sprintf("%.02f", x),
Sepal.Width = function(x) sprintf("%.04f", x)
)
ft <- theme_vanilla(ft)
ft
Set Formatter by Types of Columns
Description
Function is now defunct, use colformat_ functions instead.
Usage
set_formatter_type(...)
Replace the entire header or footer from a data frame
Description
Replace all header or footer rows using a mapping data frame.
Unlike set_header_labels() which only renames the bottom header row,
this function rebuilds the entire header (or footer) structure.
The data.frame must contain a column whose values match flextable
col_keys argument, this column will be used as join key. The
other columns will be displayed as header or footer rows. The leftmost column
is used as the top header/footer row and the rightmost column
is used as the bottom header/footer row.
Usage
set_header_df(x, mapping = NULL, key = "col_keys")
set_footer_df(x, mapping = NULL, key = "col_keys")
Arguments
x |
a 'flextable' object, see flextable-package to learn how to create 'flextable' object. |
mapping |
a |
key |
column to use as key when joigning data_mapping. |
See Also
Other row and column operations:
add_body(),
add_body_row(),
add_footer(),
add_footer_lines(),
add_footer_row(),
add_header(),
add_header_lines(),
add_header_row(),
delete_columns(),
delete_part(),
delete_rows(),
paginate(),
separate_header(),
set_header_labels(),
split_columns(),
split_rows(),
split_to_pages()
Examples
typology <- data.frame(
col_keys = c(
"Sepal.Length", "Sepal.Width", "Petal.Length",
"Petal.Width", "Species"
),
what = c("Sepal", "Sepal", "Petal", "Petal", "Species"),
measure = c("Length", "Width", "Length", "Width", "Species"),
stringsAsFactors = FALSE
)
ft_1 <- flextable(head(iris))
ft_1 <- set_header_df(ft_1, mapping = typology, key = "col_keys")
ft_1 <- merge_h(ft_1, part = "header")
ft_1 <- merge_v(ft_1, j = "Species", part = "header")
ft_1 <- theme_vanilla(ft_1)
ft_1 <- fix_border_issues(ft_1)
ft_1
typology <- data.frame(
col_keys = c(
"Sepal.Length", "Sepal.Width", "Petal.Length",
"Petal.Width", "Species"
),
unit = c("(cm)", "(cm)", "(cm)", "(cm)", ""),
stringsAsFactors = FALSE
)
ft_2 <- set_footer_df(ft_1, mapping = typology, key = "col_keys")
ft_2 <- italic(ft_2, italic = TRUE, part = "footer")
ft_2 <- theme_booktabs(ft_2)
ft_2 <- fix_border_issues(ft_2)
ft_2
Rename column labels in the header
Description
Change the display labels in the bottom row of the header.
Unlike set_header_df() which replaces the entire header structure,
this function only modifies column labels in the last header row.
Usage
set_header_labels(x, ..., values = NULL)
Arguments
x |
a 'flextable' object, see flextable-package to learn how to create 'flextable' object. |
... |
named arguments (names are data colnames), each element is a single character value specifying label to use. |
values |
a named list (names are data colnames), each element is a single character
value specifying label to use. If provided, argument |
See Also
Other row and column operations:
add_body(),
add_body_row(),
add_footer(),
add_footer_lines(),
add_footer_row(),
add_header(),
add_header_lines(),
add_header_row(),
delete_columns(),
delete_part(),
delete_rows(),
paginate(),
separate_header(),
set_header_footer_df,
split_columns(),
split_rows(),
split_to_pages()
Examples
ft <- flextable(head(iris))
ft <- set_header_labels(ft,
Sepal.Length = "Sepal length",
Sepal.Width = "Sepal width", Petal.Length = "Petal length",
Petal.Width = "Petal width"
)
ft <- flextable(head(iris))
ft <- set_header_labels(ft,
values = list(
Sepal.Length = "Sepal length",
Sepal.Width = "Sepal width",
Petal.Length = "Petal length",
Petal.Width = "Petal width"
)
)
ft
ft <- flextable(head(iris))
ft <- set_header_labels(
x = ft,
values = c(
"Sepal length",
"Sepal width", "Petal length",
"Petal width", "Species")
)
ft
Set table layout and width properties
Description
Set table layout and table width. Default to fixed algorithm.
If layout is fixed, column widths will be used to display the table;
width is ignored.
If layout is autofit, column widths will not be used; table width is used (as a percentage).
Usage
set_table_properties(
x,
layout = "fixed",
width = 0,
align = NULL,
opts_html = list(),
opts_word = list(),
opts_pdf = list(),
word_title = NULL,
word_description = NULL
)
Arguments
x |
a 'flextable' object, see flextable-package to learn how to create 'flextable' object. |
layout |
'autofit' or 'fixed' algorithm. Default to 'fixed'. |
width |
The parameter has a different effect depending on the output format. Users should consider it as a minimum width. In HTML, it is the minimum width of the space that the table should occupy. In Word, it is a preferred size and Word may decide not to strictly stick to it. It has no effect on PowerPoint and PDF output. Its default value is 0, as an effect, it only use necessary width to display all content. It is not used by the PDF output. |
align |
alignment in document (only Word, HTML and PDF), supported values are 'left', 'center' and 'right'. |
opts_html |
html options as a list. Supported elements are:
|
opts_word |
Word options as a list. Supported elements are:
|
opts_pdf |
PDF options as a list. Supported elements are:
|
word_title |
alternative text for Word table (used as title of the table) |
word_description |
alternative text for Word table (used as description of the table) |
Note
PowerPoint output ignore 'autofit layout'.
See Also
flextable(), as_flextable(), autofit(),
knit_print.flextable()
Other functions for flextable size management:
autofit(),
dim.flextable(),
dim_pretty(),
fit_columns(),
fit_to_width(),
flextable_dim(),
height(),
hrule(),
ncol_keys(),
nrow_part(),
width()
Examples
library(flextable)
ft_1 <- flextable(head(cars))
ft_1 <- autofit(ft_1)
ft_2 <- set_table_properties(ft_1, width = .5, layout = "autofit")
ft_2
ft_3 <- set_table_properties(ft_1, width = 1, layout = "autofit")
# add scroll for HTML ----
set.seed(2)
dat <- lapply(1:14, function(x) rnorm(n = 20))
dat <- setNames(dat, paste0("colname", 1:14))
dat <- as.data.frame(dat)
ft_4 <- flextable(dat)
ft_4 <- colformat_double(ft_4)
ft_4 <- bg(ft_4, j = 1, bg = "#DDDDDD", part = "all")
ft_4 <- bg(ft_4, i = 1, bg = "#DDDDDD", part = "header")
ft_4 <- autofit(ft_4)
ft_4 <- set_table_properties(
x = ft_4,
opts_html = list(
scroll = list(
height = "500px",
freeze_first_column = TRUE
)
)
)
ft_4
Create a shift table
Description
Create a shift table ready to be used with tabulator().
The function is transforming a dataset representing some 'Laboratory Tests Results' structured as CDISC clinical trial data sets format to a dataset representing the shift table.
Shift tables are tables used in clinical trial analysis. They show the progression of change from the baseline, with the progression often being along time; the number of subjects is displayed in different range (e.g. low, normal, or high) at baseline and at selected time points or intervals.
Usage
shift_table(
x,
cn_visit = "VISIT",
cn_visit_num = "VISITNUM",
cn_grade = "LBNRIND",
cn_usubjid = "USUBJID",
cn_lab_cat = NA_character_,
cn_is_baseline = "LBBLFL",
baseline_identifier = "Y",
cn_treatment = NA_character_,
grade_levels = c("LOW", "NORMAL", "HIGH"),
grade_labels = c("Low", "Normal", "High")
)
Arguments
x |
Laboratory Tests Results data frame. |
cn_visit |
column name containing visit names, default to "VISIT". |
cn_visit_num |
column name containing visit numbers, default to "VISITNUM". |
cn_grade |
column name containing reference range indicators, default to "LBNRIND". |
cn_usubjid |
column name containing unique subject inditifiers, default to "USUBJID". |
cn_lab_cat |
column name containing lab tests or examination names, default to "LBTEST". |
cn_is_baseline |
column name containing baseline flags, default to "LBBLFL". |
baseline_identifier |
baseline flag value to use for baseline identification. Its default is "Y". |
cn_treatment |
column name containing treatment names, default to |
grade_levels |
levels to use for reference range indicators |
grade_labels |
labels to use for reference range indicators |
Value
the shift table as a data.frame. Additionnal elements are provided in attributes:
"VISIT_N": count of unique subject id per visits, labs and eventually treatments. This element is supposed to be used as value for argument
hidden_dataof functiontabulator()."FUN_VISIT": a utility function to easily turn visit column as a factor column. It should be applied after the shift table creation.
"FUN_GRADE": a utility function to easily turn grade column as a factor column. It adds "MISSING/Missing" and "SUM/Sum" at the end of the set of values specified in arguments
grade_levelsandgrade_labels. It should be applied after the shift table creation.
Examples
library(data.table)
library(flextable)
# data simulation ----
USUBJID <- sprintf("01-ABC-%04.0f", 1:200)
VISITS <- c("SCREENING 1", "WEEK 2", "MONTH 3")
LBTEST <- c("Albumin", "Sodium")
VISITNUM <- seq_along(VISITS)
LBBLFL <- rep(NA_character_, length(VISITNUM))
LBBLFL[1] <- "Y"
VISIT <- data.frame(
VISIT = VISITS, VISITNUM = VISITNUM,
LBBLFL = LBBLFL, stringsAsFactors = FALSE
)
labdata <- expand.grid(
USUBJID = USUBJID, LBTEST = LBTEST,
VISITNUM = VISITNUM,
stringsAsFactors = FALSE
)
setDT(labdata)
labdata <- merge(labdata, VISIT, by = "VISITNUM")
subject_elts <- unique(labdata[, .SD, .SDcols = "USUBJID"])
subject_elts <- unique(subject_elts)
subject_elts[, c("TREAT") := list(
sample(x = c("Treatment", "Placebo"), size = .N, replace = TRUE)
)]
subject_elts[, c("TREAT") := list(
factor(.SD$TREAT, levels = c("Treatment", "Placebo"))
)]
setDF(subject_elts)
labdata <- merge(labdata, subject_elts,
by = "USUBJID", all.x = TRUE, all.y = FALSE
)
labdata[, c("LBNRIND") := list(
sample(
x = c("LOW", "NORMAL", "HIGH"), size = .N,
replace = TRUE, prob = c(.03, .9, .07)
)
)]
setDF(labdata)
# shift table calculation ----
SHIFT_TABLE <- shift_table(
x = labdata, cn_visit = "VISIT",
cn_grade = "LBNRIND",
cn_usubjid = "USUBJID",
cn_lab_cat = "LBTEST",
cn_treatment = "TREAT",
cn_is_baseline = "LBBLFL",
baseline_identifier = "Y",
grade_levels = c("LOW", "NORMAL", "HIGH")
)
# get attrs for post treatment ----
SHIFT_TABLE_VISIT <- attr(SHIFT_TABLE, "VISIT_N")
visit_as_factor <- attr(SHIFT_TABLE, "FUN_VISIT")
range_as_factor <- attr(SHIFT_TABLE, "FUN_GRADE")
# post treatments ----
SHIFT_TABLE$VISIT <- visit_as_factor(SHIFT_TABLE$VISIT)
SHIFT_TABLE$BASELINE <- range_as_factor(SHIFT_TABLE$BASELINE)
SHIFT_TABLE$LBNRIND <- range_as_factor(SHIFT_TABLE$LBNRIND)
SHIFT_TABLE_VISIT$VISIT <- visit_as_factor(SHIFT_TABLE_VISIT$VISIT)
# tabulator ----
my_format <- function(z) {
formatC(z * 100,
digits = 1, format = "f",
flag = "0", width = 4
)
}
tab <- tabulator(
x = SHIFT_TABLE,
hidden_data = SHIFT_TABLE_VISIT,
row_compose = list(
VISIT = as_paragraph(VISIT, "\n(N=", N_VISIT, ")")
),
rows = c("LBTEST", "VISIT", "BASELINE"),
columns = c("TREAT", "LBNRIND"),
`n` = as_paragraph(N),
`%` = as_paragraph(as_chunk(PCT, formatter = my_format))
)
# as_flextable ----
ft_1 <- as_flextable(
x = tab, separate_with = "VISIT",
label_rows = c(
LBTEST = "Lab Test", VISIT = "Visit",
BASELINE = "Reference Range Indicator"
)
)
ft_1
Split a flextable into pages by columns
Description
Split a flextable into a list of flextables whose columns fit within a given width (in inches). This is useful for paginating wide tables in Word or PowerPoint output.
Usage
split_columns(x, max_width, rep_cols = NULL, unit = "in")
Arguments
x |
a 'flextable' object, see flextable-package to learn how to create 'flextable' object. |
max_width |
Maximum width for each page (in inches by default). |
rep_cols |
Columns to repeat on every page. Can be a character
vector of column names or an integer vector of column positions.
|
unit |
Unit for |
Value
A list of flextable objects. If no splitting is needed, a single-element list is returned.
See Also
Other row and column operations:
add_body(),
add_body_row(),
add_footer(),
add_footer_lines(),
add_footer_row(),
add_header(),
add_header_lines(),
add_header_row(),
delete_columns(),
delete_part(),
delete_rows(),
paginate(),
separate_header(),
set_header_footer_df,
set_header_labels(),
split_rows(),
split_to_pages()
Examples
ft <- flextable(head(mtcars))
ft_pages <- split_columns(ft, max_width = 5)
length(ft_pages)
Split a flextable into pages by rows
Description
Split a flextable into a list of flextables whose body
rows fit within a given height (in inches). Header and footer are
repeated on every page. An optional group argument keeps row groups
together (no page break inside a group).
Usage
split_rows(x, max_height, group = integer(0), unit = "in")
Arguments
x |
a 'flextable' object, see flextable-package to learn how to create 'flextable' object. |
max_height |
Maximum height for each page, including header and footer (in inches by default). |
group |
Integer vector of body row indices that start a new group.
Rows belonging to the same group are kept together on a single page.
Default is |
unit |
Unit for |
Value
A list of flextable objects. If no splitting is needed, a single-element list is returned.
Note
Footnotes are currently repeated on every page, even when they reference rows that only appear on a specific page. This limitation will be resolved in a future version when footnotes are restructured to track their association with body rows.
See Also
Other row and column operations:
add_body(),
add_body_row(),
add_footer(),
add_footer_lines(),
add_footer_row(),
add_header(),
add_header_lines(),
add_header_row(),
delete_columns(),
delete_part(),
delete_rows(),
paginate(),
separate_header(),
set_header_footer_df,
set_header_labels(),
split_columns(),
split_to_pages()
Examples
ft <- flextable(iris)
ft_pages <- split_rows(ft, max_height = 3)
length(ft_pages)
Split a flextable into pages by rows and columns
Description
Split a flextable into a list of flextables that fit within the given height and width constraints. Rows are split first, then columns are split within each row page.
This is a convenience wrapper around split_rows() and
split_columns().
Usage
split_to_pages(
x,
max_width = NULL,
max_height = NULL,
rep_cols = NULL,
group = integer(0),
unit = "in"
)
Arguments
x |
a 'flextable' object, see flextable-package to learn how to create 'flextable' object. |
max_width |
Maximum width per page (in inches by default).
|
max_height |
Maximum height per page, including header and
footer (in inches by default). |
rep_cols |
Columns to repeat on every horizontal page. Can be
a character vector of column names, an integer vector of column
positions, or |
group |
Integer vector of body row indices that start a new
group. Default is |
unit |
Unit for |
Value
A list of flextable objects.
See Also
Other row and column operations:
add_body(),
add_body_row(),
add_footer(),
add_footer_lines(),
add_footer_row(),
add_header(),
add_header_lines(),
add_header_row(),
delete_columns(),
delete_part(),
delete_rows(),
paginate(),
separate_header(),
set_header_footer_df,
set_header_labels(),
split_columns(),
split_rows()
Examples
ft <- flextable(iris)
ft_pages <- split_to_pages(ft, max_width = 4, max_height = 5)
length(ft_pages)
Set formatting properties on a flextable selection
Description
style() applies text, paragraph and cell formatting properties
to a selection of rows and columns in one call. It is a lower-level
function that bundles what the convenience functions do individually:
text (
pr_t): font family, size, color, bold, italic, etc., same properties asbold(),italic(),color(),fontsize(),font(),highlight().paragraph (
pr_p): alignment, padding, line spacing, same properties asalign(),padding(),line_spacing().cell (
pr_c): background colour, borders, vertical alignment, same properties asbg(),border(),valign().
Use style() when you need to set several property types at once
on the same selection; use the convenience functions when you
only need to change one aspect.
Note that style() modifies an existing flextable.
To change the initial formatting applied to every new
flextable, use set_flextable_defaults() instead.
Usage
style(
x,
i = NULL,
j = NULL,
pr_t = NULL,
pr_p = NULL,
pr_c = NULL,
part = "body"
)
Arguments
x |
a 'flextable' object, see flextable-package to learn how to create 'flextable' object. |
i |
row selector, see section Row selection with the |
j |
column selector, see section Column selection with the |
pr_t |
an |
pr_p |
an |
pr_c |
an |
part |
part selector, see section Part selection with the |
See Also
Other formatting shortcuts:
align(),
bg(),
bold(),
color(),
empty_blanks(),
font(),
fontsize(),
highlight(),
indentation(),
italic(),
keep_with_next(),
line_spacing(),
padding(),
rotate(),
tab_settings(),
valign()
Examples
library(officer)
def_cell <- fp_cell(border = fp_border(color = "wheat"))
def_par <- fp_par(text.align = "center")
ft <- flextable(head(mtcars))
ft <- style(ft, pr_c = def_cell, pr_p = def_par, part = "all")
ft <- style(ft, ~ drat > 3.5, ~ vs + am + gear + carb,
pr_t = fp_text(color = "red", italic = TRUE)
)
ft
Prepare descriptive statistics for flextable
Description
It performs a univariate statistical analysis of a dataset
by group and formats the results so that they can be used with
the tabulator() function or directly with as_flextable.
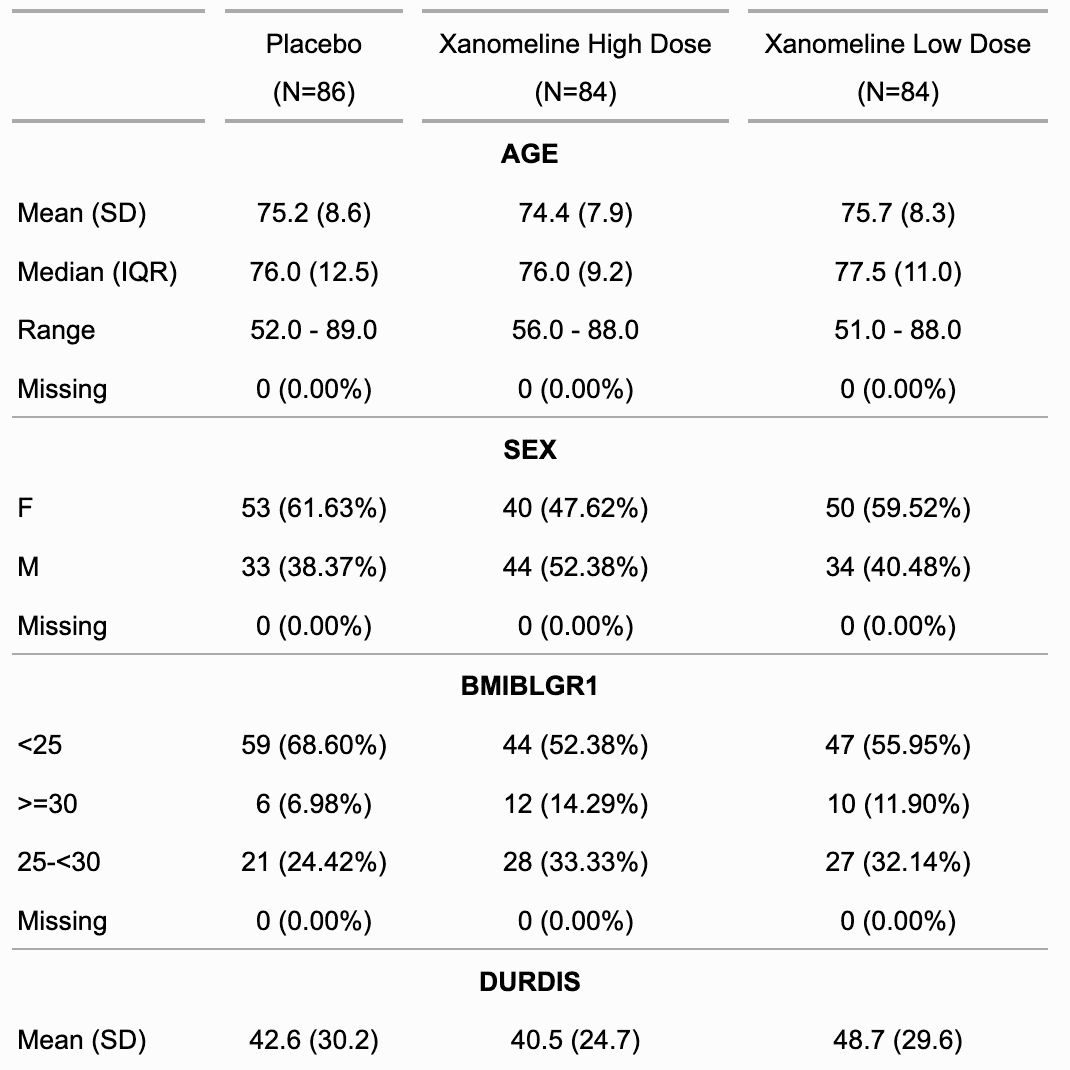
Usage
summarizor(
x,
by = character(),
overall_label = NULL,
num_stats = c("mean_sd", "median_iqr", "range"),
hide_null_na = TRUE,
use_labels = TRUE
)
Arguments
x |
dataset |
by |
columns names to be used as grouping columns |
overall_label |
label to use as overall label |
num_stats |
available statistics for numerical columns to show, available options are "mean_sd", "median_iqr" and "range". |
hide_null_na |
if TRUE (default), NA counts will not be shown when 0. |
use_labels |
Logical; if TRUE, any column labels or value labels present in the dataset will be used for display purposes. Defaults to TRUE. |
Note
This is very first version of the function; be aware it can evolve or change.
See Also
Examples
z <- summarizor(CO2[-c(1, 4)],
by = "Treatment",
overall_label = "Overall"
)
ft_1 <- as_flextable(z)
ft_1
ft_2 <- as_flextable(z, sep_w = 0, spread_first_col = TRUE)
ft_2
z <- summarizor(CO2[-c(1, 4)])
ft_3 <- as_flextable(z, sep_w = 0, spread_first_col = TRUE)
ft_3
Surround cells with borders
Description
surround() draws borders around specific cells, highlighting
them individually.
To set borders for the whole table, use border_outer(),
border_inner_h() and border_inner_v().
All the following functions also support the
row and column selector i and j:
-
hline(): set bottom borders (inner horizontal) -
vline(): set right borders (inner vertical) -
hline_top(): set the top border (outer horizontal) -
vline_left(): set the left border (outer vertical)
Usage
surround(
x,
i = NULL,
j = NULL,
border = NULL,
border.top = NULL,
border.bottom = NULL,
border.left = NULL,
border.right = NULL,
part = "body"
)
Arguments
x |
a 'flextable' object, see flextable-package to learn how to create 'flextable' object. |
i |
row selector, see section Row selection with the |
j |
column selector, see section Column selection with the |
border |
border (shortcut for top, bottom, left and right) |
border.top |
border top |
border.bottom |
border bottom |
border.left |
border left |
border.right |
border right |
part |
part selector, see section Part selection with the |
See Also
Other borders management:
border_inner(),
border_inner_h(),
border_inner_v(),
border_outer(),
border_remove(),
hline(),
hline_bottom(),
hline_top(),
vline(),
vline_left(),
vline_right()
Examples
library(officer)
library(flextable)
# cell to highlight
vary_i <- 1:3
vary_j <- 1:3
std_border <- fp_border(color = "orange")
ft <- flextable(head(iris))
ft <- border_remove(x = ft)
ft <- border_outer(x = ft, border = std_border)
for (id in seq_along(vary_i)) {
ft <- bg(
x = ft,
i = vary_i[id],
j = vary_j[id], bg = "yellow"
)
ft <- surround(
x = ft,
i = vary_i[id],
j = vary_j[id],
border.left = std_border,
border.right = std_border,
part = "body"
)
}
ft <- autofit(ft)
ft
# # render
# print(ft, preview = "pptx")
# print(ft, preview = "docx")
# print(ft, preview = "pdf")
# print(ft, preview = "html")
Set tabulation marks configuration
Description
Define tabulation marks configuration. Specifying the positions and types of tabulation marks in table paragraphs helps organize content, especially in clinical tables, by aligning numbers properly.
Usage
tab_settings(x, i = NULL, j = NULL, value = TRUE, part = "body")
Arguments
x |
a 'flextable' object, see flextable-package to learn how to create 'flextable' object. |
i |
row selector, see section Row selection with the |
j |
column selector, see section Column selection with the |
value |
an object generated by |
part |
part selector, see section Part selection with the |
See Also
Other formatting shortcuts:
align(),
bg(),
bold(),
color(),
empty_blanks(),
font(),
fontsize(),
highlight(),
indentation(),
italic(),
keep_with_next(),
line_spacing(),
padding(),
rotate(),
style(),
valign()
Examples
library(officer)
library(flextable)
z <- data.frame(
Statistic = c("Median (Q1 ; Q3)", "Min ; Max"),
Value = c(
"\t999.99\t(99.9 ; 99.9)",
"\t9.99\t(9999.9 ; 99.9)"
)
)
ts <- fp_tabs(
fp_tab(pos = 0.4, style = "decimal"),
fp_tab(pos = 1.4, style = "decimal")
)
zz <- flextable(z)
zz <- tab_settings(zz, j = 2, value = ts)
zz <- width(zz, width = c(1.5, 2))
save_as_docx(zz, path = tempfile(fileext = ".docx"))
Create pivot-style summary tables
Description
It tabulates a data.frame representing an aggregation
which is then transformed as a flextable with
as_flextable. The function
allows to define any display with the syntax of flextable in
a table whose layout is showing dimensions of the aggregation
across rows and columns.
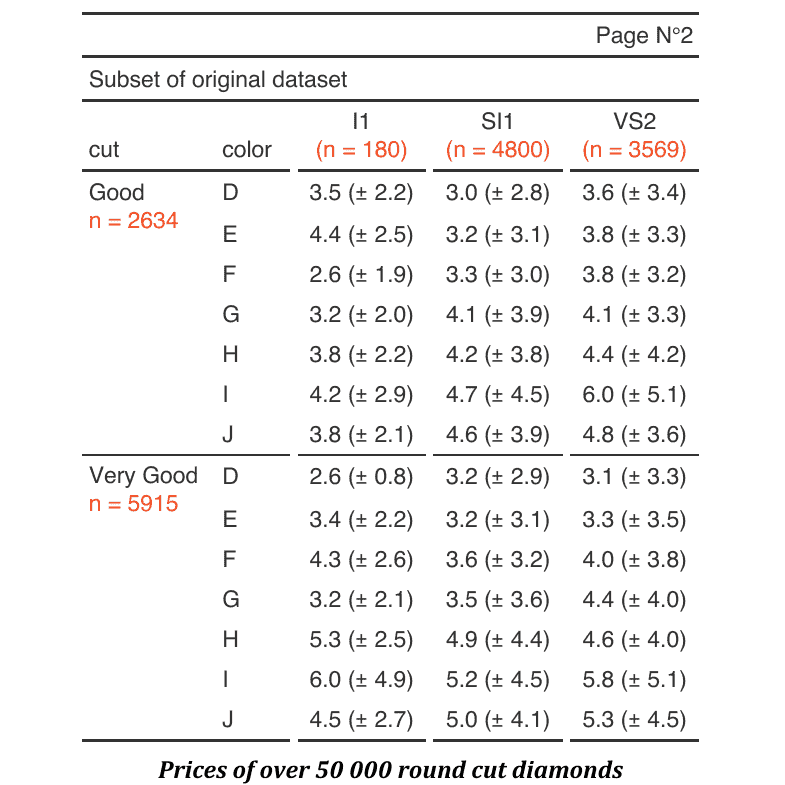
Usage
tabulator(
x,
rows,
columns,
datasup_first = NULL,
datasup_last = NULL,
hidden_data = NULL,
row_compose = list(),
...
)
## S3 method for class 'tabulator'
summary(object, ...)
Arguments
x |
an aggregated data.frame |
rows |
column names to use in rows dimensions |
columns |
column names to use in columns dimensions |
datasup_first |
additional data that will be merged with table and placed after the columns presenting the row dimensions. |
datasup_last |
additional data that will be merged with table and placed at the end of the table. |
|
additional data that will be merged with
table, the columns are not presented but can be used
with | |
row_compose |
a list of call to |
... |
named arguments calling function |
object |
an object returned by function
|
Value
an object of class tabulator.
Methods (by generic)
-
summary(tabulator): callsummary()to get a data.frame describing mappings between variables and their names in the flextable. This data.frame contains a column namedcol_keyswhere are stored the names that can be used for further selections.
Note
This is very first version of the function; be aware it can evolve or change.
See Also
as_flextable.tabulator(), summarizor(),
as_grouped_data(), tabulator_colnames()
Examples
## Not run:
set_flextable_defaults(digits = 2, border.color = "gray")
library(data.table)
# example 1 ----
if (require("stats")) {
dat <- aggregate(breaks ~ wool + tension,
data = warpbreaks, mean
)
cft_1 <- tabulator(
x = dat, rows = "wool",
columns = "tension",
`mean` = as_paragraph(as_chunk(breaks)),
`(N)` = as_paragraph(as_chunk(length(breaks), formatter = fmt_int))
)
ft_1 <- as_flextable(cft_1)
ft_1
}
# example 2 ----
if (require("ggplot2")) {
multi_fun <- function(x) {
list(mean = mean(x), sd = sd(x))
}
dat <- as.data.table(ggplot2::diamonds)
dat <- dat[cut %in% c("Fair", "Good", "Very Good")]
dat <- dat[, unlist(lapply(.SD, multi_fun),
recursive = FALSE
),
.SDcols = c("z", "y"),
by = c("cut", "color")
]
tab_2 <- tabulator(
x = dat, rows = "color",
columns = "cut",
`z stats` = as_paragraph(as_chunk(fmt_avg_dev(z.mean, z.sd, digit2 = 2))),
`y stats` = as_paragraph(as_chunk(fmt_avg_dev(y.mean, y.sd, digit2 = 2)))
)
ft_2 <- as_flextable(tab_2)
ft_2 <- autofit(x = ft_2, add_w = .05)
ft_2
}
# example 3 ----
# data.table version
dat <- melt(as.data.table(iris),
id.vars = "Species",
variable.name = "name", value.name = "value"
)
dat <- dat[,
list(
avg = mean(value, na.rm = TRUE),
sd = sd(value, na.rm = TRUE)
),
by = c("Species", "name")
]
# dplyr version
# library(dplyr)
# dat <- iris %>%
# pivot_longer(cols = -c(Species)) %>%
# group_by(Species, name) %>%
# summarise(avg = mean(value, na.rm = TRUE),
# sd = sd(value, na.rm = TRUE),
# .groups = "drop")
tab_3 <- tabulator(
x = dat, rows = c("Species"),
columns = "name",
`mean (sd)` = as_paragraph(
as_chunk(avg),
" (", as_chunk(sd), ")"
)
)
ft_3 <- as_flextable(tab_3)
ft_3
init_flextable_defaults()
## End(Not run)
Column keys of tabulator objects
Description
The function provides a way to get column keys
associated with the flextable corresponding to a tabulator()
object. It helps in customizing or programing with tabulator.
The function is using column names from the original dataset, eventually filters and returns the names corresponding to the selection.
Usage
tabulator_colnames(x, columns, ..., type = NULL)
Arguments
x |
a |
columns |
column names to look for |
... |
any filter conditions that use variables
names, the same than the argument |
type |
the type of column to look for, it can be:
|
See Also
tabulator(), as_flextable.tabulator()
Examples
library(flextable)
cancer_dat <- data.frame(
count = c(
9L, 5L, 1L, 2L, 2L, 1L, 9L, 3L, 1L, 10L, 2L, 1L, 1L, 2L, 0L, 3L,
2L, 1L, 1L, 2L, 0L, 12L, 4L, 1L, 7L, 3L, 1L, 5L, 5L, 3L, 10L,
4L, 1L, 4L, 2L, 0L, 3L, 1L, 0L, 4L, 4L, 2L, 42L, 28L, 19L, 26L,
19L, 11L, 12L, 10L, 7L, 10L, 5L, 6L, 5L, 0L, 3L, 4L, 3L, 3L,
1L, 2L, 3L
),
risktime = c(
157L, 77L, 21L, 139L, 68L, 17L, 126L, 63L, 14L, 102L, 55L,
12L, 88L, 50L, 10L, 82L, 45L, 8L, 76L, 42L, 6L, 134L, 71L,
22L, 110L, 63L, 18L, 96L, 58L, 14L, 86L, 42L, 10L, 66L,
35L, 8L, 59L, 32L, 8L, 51L, 28L, 6L, 212L, 130L, 101L,
136L, 72L, 63L, 90L, 42L, 43L, 64L, 21L, 32L, 47L, 14L,
21L, 39L, 13L, 14L, 29L, 7L, 10L
),
time = rep(as.character(1:7), 3),
histology = rep(as.character(1:3), 21),
stage = rep(as.character(1:3), each = 21)
)
datasup_first <- data.frame(
time = factor(1:7, levels = 1:7),
zzz = runif(7)
)
z <- tabulator(cancer_dat,
rows = "time",
columns = c("histology", "stage"),
datasup_first = datasup_first,
n = as_paragraph(as_chunk(count))
)
j <- tabulator_colnames(
x = z, type = "columns",
columns = c("n"),
stage %in% 1
)
src <- tabulator_colnames(
x = z, type = "hidden",
columns = c("count"),
stage %in% 1
)
if (require("scales")) {
colourer <- col_numeric(
palette = c("wheat", "red"),
domain = c(0, 45)
)
ft_1 <- as_flextable(z)
ft_1 <- bg(
ft_1,
bg = colourer, part = "body",
j = j, source = src
)
ft_1
}
Apply alafoli theme
Description
Apply alafoli theme
Usage
theme_alafoli(x)
Arguments
x |
a 'flextable' object, see flextable-package to learn how to create 'flextable' object. |
behavior
Theme functions are not like 'ggplot2' themes. They are applied to the existing table immediately. If you add a row in the footer, the new row is not formatted with the theme. The theme function applies the theme only to existing elements when the function is called.
That is why theme functions should be applied after all elements of the table have been added (mainly additionnal header or footer rows).
If you want to automatically apply a theme function to each flextable,
you can use the theme_fun argument of set_flextable_defaults(); be
aware that this theme function is applied as the last instruction when
calling flextable() - so if you add headers or footers to the array,
they will not be formatted with the theme.
You can also use the post_process_html argument
of set_flextable_defaults() (or post_process_pdf,
post_process_docx, post_process_pptx) to specify a theme
to be applied systematically before the flextable() is printed;
in this case, don't forget to take care that the theme doesn't
override any formatting done before the print statement.
See Also
Other themes and defaults:
get_flextable_defaults(),
set_flextable_defaults(),
theme_apa(),
theme_booktabs(),
theme_borderless(),
theme_box(),
theme_tron(),
theme_tron_legacy(),
theme_vader(),
theme_vanilla(),
theme_zebra()
Examples
ft <- flextable(head(airquality))
ft <- theme_alafoli(ft)
ft
Apply APA theme
Description
Apply theme APA (the stylistic style of the American Psychological Association) to a flextable
Usage
theme_apa(x, ...)
Arguments
x |
a 'flextable' object, see flextable-package to learn how to create 'flextable' object. |
... |
unused |
behavior
Theme functions are not like 'ggplot2' themes. They are applied to the existing table immediately. If you add a row in the footer, the new row is not formatted with the theme. The theme function applies the theme only to existing elements when the function is called.
That is why theme functions should be applied after all elements of the table have been added (mainly additionnal header or footer rows).
If you want to automatically apply a theme function to each flextable,
you can use the theme_fun argument of set_flextable_defaults(); be
aware that this theme function is applied as the last instruction when
calling flextable() - so if you add headers or footers to the array,
they will not be formatted with the theme.
You can also use the post_process_html argument
of set_flextable_defaults() (or post_process_pdf,
post_process_docx, post_process_pptx) to specify a theme
to be applied systematically before the flextable() is printed;
in this case, don't forget to take care that the theme doesn't
override any formatting done before the print statement.
See Also
Other themes and defaults:
get_flextable_defaults(),
set_flextable_defaults(),
theme_alafoli(),
theme_booktabs(),
theme_borderless(),
theme_box(),
theme_tron(),
theme_tron_legacy(),
theme_vader(),
theme_vanilla(),
theme_zebra()
Examples
ft <- flextable(head(mtcars * 22.22))
ft <- theme_apa(ft)
ft
Apply booktabs theme
Description
Apply theme booktabs to a flextable
Usage
theme_booktabs(x, bold_header = FALSE, ...)
Arguments
x |
a 'flextable' object, see flextable-package to learn how to create 'flextable' object. |
bold_header |
header will be bold if TRUE. |
... |
unused |
behavior
Theme functions are not like 'ggplot2' themes. They are applied to the existing table immediately. If you add a row in the footer, the new row is not formatted with the theme. The theme function applies the theme only to existing elements when the function is called.
That is why theme functions should be applied after all elements of the table have been added (mainly additionnal header or footer rows).
If you want to automatically apply a theme function to each flextable,
you can use the theme_fun argument of set_flextable_defaults(); be
aware that this theme function is applied as the last instruction when
calling flextable() - so if you add headers or footers to the array,
they will not be formatted with the theme.
You can also use the post_process_html argument
of set_flextable_defaults() (or post_process_pdf,
post_process_docx, post_process_pptx) to specify a theme
to be applied systematically before the flextable() is printed;
in this case, don't forget to take care that the theme doesn't
override any formatting done before the print statement.
See Also
Other themes and defaults:
get_flextable_defaults(),
set_flextable_defaults(),
theme_alafoli(),
theme_apa(),
theme_borderless(),
theme_box(),
theme_tron(),
theme_tron_legacy(),
theme_vader(),
theme_vanilla(),
theme_zebra()
Examples
ft <- flextable(head(airquality))
ft <- theme_booktabs(ft)
ft
Apply borderless theme
Description
Apply theme borderless to a flextable. All borders are removed. Header text is bold, text columns are left aligned, other columns are right aligned.
Usage
theme_borderless(x)
Arguments
x |
a 'flextable' object, see flextable-package to learn how to create 'flextable' object. |
behavior
Theme functions are not like 'ggplot2' themes. They are applied to the existing table immediately. If you add a row in the footer, the new row is not formatted with the theme. The theme function applies the theme only to existing elements when the function is called.
That is why theme functions should be applied after all elements of the table have been added (mainly additionnal header or footer rows).
If you want to automatically apply a theme function to each flextable,
you can use the theme_fun argument of set_flextable_defaults(); be
aware that this theme function is applied as the last instruction when
calling flextable() - so if you add headers or footers to the array,
they will not be formatted with the theme.
You can also use the post_process_html argument
of set_flextable_defaults() (or post_process_pdf,
post_process_docx, post_process_pptx) to specify a theme
to be applied systematically before the flextable() is printed;
in this case, don't forget to take care that the theme doesn't
override any formatting done before the print statement.
See Also
Other themes and defaults:
get_flextable_defaults(),
set_flextable_defaults(),
theme_alafoli(),
theme_apa(),
theme_booktabs(),
theme_box(),
theme_tron(),
theme_tron_legacy(),
theme_vader(),
theme_vanilla(),
theme_zebra()
Examples
ft <- flextable(head(airquality))
ft <- theme_borderless(ft)
ft
Apply box theme
Description
Apply theme box to a flextable
Usage
theme_box(x)
Arguments
x |
a 'flextable' object, see flextable-package to learn how to create 'flextable' object. |
behavior
Theme functions are not like 'ggplot2' themes. They are applied to the existing table immediately. If you add a row in the footer, the new row is not formatted with the theme. The theme function applies the theme only to existing elements when the function is called.
That is why theme functions should be applied after all elements of the table have been added (mainly additionnal header or footer rows).
If you want to automatically apply a theme function to each flextable,
you can use the theme_fun argument of set_flextable_defaults(); be
aware that this theme function is applied as the last instruction when
calling flextable() - so if you add headers or footers to the array,
they will not be formatted with the theme.
You can also use the post_process_html argument
of set_flextable_defaults() (or post_process_pdf,
post_process_docx, post_process_pptx) to specify a theme
to be applied systematically before the flextable() is printed;
in this case, don't forget to take care that the theme doesn't
override any formatting done before the print statement.
See Also
Other themes and defaults:
get_flextable_defaults(),
set_flextable_defaults(),
theme_alafoli(),
theme_apa(),
theme_booktabs(),
theme_borderless(),
theme_tron(),
theme_tron_legacy(),
theme_vader(),
theme_vanilla(),
theme_zebra()
Examples
ft <- flextable(head(airquality))
ft <- theme_box(ft)
ft
Apply tron theme
Description
Apply theme tron to a flextable
Usage
theme_tron(x)
Arguments
x |
a 'flextable' object, see flextable-package to learn how to create 'flextable' object. |
behavior
Theme functions are not like 'ggplot2' themes. They are applied to the existing table immediately. If you add a row in the footer, the new row is not formatted with the theme. The theme function applies the theme only to existing elements when the function is called.
That is why theme functions should be applied after all elements of the table have been added (mainly additionnal header or footer rows).
If you want to automatically apply a theme function to each flextable,
you can use the theme_fun argument of set_flextable_defaults(); be
aware that this theme function is applied as the last instruction when
calling flextable() - so if you add headers or footers to the array,
they will not be formatted with the theme.
You can also use the post_process_html argument
of set_flextable_defaults() (or post_process_pdf,
post_process_docx, post_process_pptx) to specify a theme
to be applied systematically before the flextable() is printed;
in this case, don't forget to take care that the theme doesn't
override any formatting done before the print statement.
See Also
Other themes and defaults:
get_flextable_defaults(),
set_flextable_defaults(),
theme_alafoli(),
theme_apa(),
theme_booktabs(),
theme_borderless(),
theme_box(),
theme_tron_legacy(),
theme_vader(),
theme_vanilla(),
theme_zebra()
Examples
ft <- flextable(head(airquality))
ft <- theme_tron(ft)
ft
Apply tron legacy theme
Description
Apply theme tron legacy to a flextable
Usage
theme_tron_legacy(x)
Arguments
x |
a 'flextable' object, see flextable-package to learn how to create 'flextable' object. |
behavior
Theme functions are not like 'ggplot2' themes. They are applied to the existing table immediately. If you add a row in the footer, the new row is not formatted with the theme. The theme function applies the theme only to existing elements when the function is called.
That is why theme functions should be applied after all elements of the table have been added (mainly additionnal header or footer rows).
If you want to automatically apply a theme function to each flextable,
you can use the theme_fun argument of set_flextable_defaults(); be
aware that this theme function is applied as the last instruction when
calling flextable() - so if you add headers or footers to the array,
they will not be formatted with the theme.
You can also use the post_process_html argument
of set_flextable_defaults() (or post_process_pdf,
post_process_docx, post_process_pptx) to specify a theme
to be applied systematically before the flextable() is printed;
in this case, don't forget to take care that the theme doesn't
override any formatting done before the print statement.
See Also
Other themes and defaults:
get_flextable_defaults(),
set_flextable_defaults(),
theme_alafoli(),
theme_apa(),
theme_booktabs(),
theme_borderless(),
theme_box(),
theme_tron(),
theme_vader(),
theme_vanilla(),
theme_zebra()
Examples
ft <- flextable(head(airquality))
ft <- theme_tron_legacy(ft)
ft
Apply Sith Lord Darth Vader theme
Description
Apply Sith Lord Darth Vader theme to a flextable
Usage
theme_vader(x, ...)
Arguments
x |
a 'flextable' object, see flextable-package to learn how to create 'flextable' object. |
... |
unused |
behavior
Theme functions are not like 'ggplot2' themes. They are applied to the existing table immediately. If you add a row in the footer, the new row is not formatted with the theme. The theme function applies the theme only to existing elements when the function is called.
That is why theme functions should be applied after all elements of the table have been added (mainly additionnal header or footer rows).
If you want to automatically apply a theme function to each flextable,
you can use the theme_fun argument of set_flextable_defaults(); be
aware that this theme function is applied as the last instruction when
calling flextable() - so if you add headers or footers to the array,
they will not be formatted with the theme.
You can also use the post_process_html argument
of set_flextable_defaults() (or post_process_pdf,
post_process_docx, post_process_pptx) to specify a theme
to be applied systematically before the flextable() is printed;
in this case, don't forget to take care that the theme doesn't
override any formatting done before the print statement.
See Also
Other themes and defaults:
get_flextable_defaults(),
set_flextable_defaults(),
theme_alafoli(),
theme_apa(),
theme_booktabs(),
theme_borderless(),
theme_box(),
theme_tron(),
theme_tron_legacy(),
theme_vanilla(),
theme_zebra()
Examples
ft <- flextable(head(airquality))
ft <- theme_vader(ft)
ft
Apply vanilla theme
Description
Apply theme vanilla to a flextable: The external horizontal lines of the different parts of the table (body, header, footer) are black 2 points thick, the external horizontal lines of the different parts are black 0.5 point thick. Header text is bold, text columns are left aligned, other columns are right aligned.
Usage
theme_vanilla(x)
Arguments
x |
a 'flextable' object, see flextable-package to learn how to create 'flextable' object. |
behavior
Theme functions are not like 'ggplot2' themes. They are applied to the existing table immediately. If you add a row in the footer, the new row is not formatted with the theme. The theme function applies the theme only to existing elements when the function is called.
That is why theme functions should be applied after all elements of the table have been added (mainly additionnal header or footer rows).
If you want to automatically apply a theme function to each flextable,
you can use the theme_fun argument of set_flextable_defaults(); be
aware that this theme function is applied as the last instruction when
calling flextable() - so if you add headers or footers to the array,
they will not be formatted with the theme.
You can also use the post_process_html argument
of set_flextable_defaults() (or post_process_pdf,
post_process_docx, post_process_pptx) to specify a theme
to be applied systematically before the flextable() is printed;
in this case, don't forget to take care that the theme doesn't
override any formatting done before the print statement.
See Also
Other themes and defaults:
get_flextable_defaults(),
set_flextable_defaults(),
theme_alafoli(),
theme_apa(),
theme_booktabs(),
theme_borderless(),
theme_box(),
theme_tron(),
theme_tron_legacy(),
theme_vader(),
theme_zebra()
Examples
ft <- flextable(head(airquality))
ft <- theme_vanilla(ft)
ft
Apply zebra theme
Description
Apply theme zebra to a flextable
Usage
theme_zebra(
x,
odd_header = "#CFCFCF",
odd_body = "#EFEFEF",
even_header = "transparent",
even_body = "transparent"
)
Arguments
x |
a 'flextable' object, see flextable-package to learn how to create 'flextable' object. |
odd_header, odd_body, even_header, even_body |
odd/even colors for table header and body |
behavior
Theme functions are not like 'ggplot2' themes. They are applied to the existing table immediately. If you add a row in the footer, the new row is not formatted with the theme. The theme function applies the theme only to existing elements when the function is called.
That is why theme functions should be applied after all elements of the table have been added (mainly additionnal header or footer rows).
If you want to automatically apply a theme function to each flextable,
you can use the theme_fun argument of set_flextable_defaults(); be
aware that this theme function is applied as the last instruction when
calling flextable() - so if you add headers or footers to the array,
they will not be formatted with the theme.
You can also use the post_process_html argument
of set_flextable_defaults() (or post_process_pdf,
post_process_docx, post_process_pptx) to specify a theme
to be applied systematically before the flextable() is printed;
in this case, don't forget to take care that the theme doesn't
override any formatting done before the print statement.
See Also
Other themes and defaults:
get_flextable_defaults(),
set_flextable_defaults(),
theme_alafoli(),
theme_apa(),
theme_booktabs(),
theme_borderless(),
theme_box(),
theme_tron(),
theme_tron_legacy(),
theme_vader(),
theme_vanilla()
Examples
ft <- flextable(head(airquality))
ft <- theme_zebra(ft)
ft
Get HTML code as a string
Description
Generate HTML code of corresponding flextable as an HTML table or an HTML image.
Usage
## S3 method for class 'flextable'
to_html(x, type = c("table", "img"), ...)
Arguments
x |
a 'flextable' object, see flextable-package to learn how to create 'flextable' object. |
type |
output type. one of "table" or "img". |
... |
unused |
Value
If type='img', the result will be a string
containing HTML code of an image tag, otherwise, the
result will be a string containing HTML code of
a table tag.
See Also
Other functions for flextable output and export:
df_printer(),
flextable_to_rmd(),
gen_grob(),
htmltools_value(),
knit_print.flextable(),
plot.flextable(),
print.flextable(),
repair_docx(),
save_as_docx(),
save_as_html(),
save_as_image(),
save_as_pptx(),
save_as_rtf(),
wrap_flextable()
Examples
library(officer)
library(flextable)
x <- to_html(as_flextable(cars))
Set data.frame automatic printing as a flextable
Description
Define df_printer() as data.frame
print method in an R Markdown document.
In a setup run chunk:
flextable::use_df_printer()
Usage
use_df_printer()
See Also
Other flextable configuration:
add_latex_dep(),
use_flextable_qmd(),
use_model_printer()
Install the flextable-qmd Quarto extension
Description
Copies the flextable-qmd Quarto extension (bundled with
flextable) into the _extensions/ directory of a
Quarto project. The extension provides Lua filters
that resolve Quarto markdown content produced by
as_qmd() inside flextable cells for HTML, PDF,
Typst and Word (docx) output formats.
After installation, add the filter to your document or project YAML:
filters: - flextable-qmd
This single filter is all that is required for HTML,
PDF and Typst (format: typst) output.
For Word (docx) output with labelled flextable chunks
(e.g. #| label: tbl-xxx), add the post-render filter
to remove the wrapper table Quarto creates around the
flextable (this extra filter is not needed for Typst,
where the table is embedded directly in the figure):
filters:
- flextable-qmd
- at: post-render
path: _extensions/flextable-qmd/unwrap-float.lua
Usage
use_flextable_qmd(path = ".", quiet = FALSE)
Arguments
path |
Path to the Quarto project root. Defaults to the current working directory. |
quiet |
If |
Value
The path to the installed extension (invisibly).
See Also
as_qmd() for creating Quarto markdown chunks,
knit_print.flextable() for rendering options in knitr documents.
Other flextable configuration:
add_latex_dep(),
use_df_printer(),
use_model_printer()
Examples
## Not run:
use_flextable_qmd()
## End(Not run)
Set automatic flextable printing for models
Description
Define as_flextable() as
print method in an R Markdown document for models
of class:
lm
glm
models from package 'lme' and 'lme4'
htest (t.test, chisq.test, ...)
gam
kmeans and pam
In a setup run chunk:
flextable::use_model_printer()
Usage
use_model_printer()
See Also
Other flextable configuration:
add_latex_dep(),
use_df_printer(),
use_flextable_qmd()
Set vertical alignment
Description
Change the vertical alignment of selected rows and columns of a flextable.
Usage
valign(x, i = NULL, j = NULL, valign = "center", part = "body")
Arguments
x |
a 'flextable' object, see flextable-package to learn how to create 'flextable' object. |
i |
row selector, see section Row selection with the |
j |
column selector, see section Column selection with the |
valign |
vertical alignment of paragraph within cell, one of "center" or "top" or "bottom". |
part |
part selector, see section Part selection with the |
See Also
Other formatting shortcuts:
align(),
bg(),
bold(),
color(),
empty_blanks(),
font(),
fontsize(),
highlight(),
indentation(),
italic(),
keep_with_next(),
line_spacing(),
padding(),
rotate(),
style(),
tab_settings()
Examples
ft_1 <- flextable(iris[c(1:3, 51:53, 101:103), ])
ft_1 <- theme_box(ft_1)
ft_1 <- merge_v(ft_1, j = 5)
ft_1
ft_2 <- valign(ft_1, j = 5, valign = "top", part = "all")
ft_2
Set vertical borders to the right of selected columns
Description
vline() draws a vertical line to the right of each
selected column by setting the right border of cells at
column j (and the left border of cells at column j + 1
so that the line renders consistently across output formats).
Use the j selector to target specific columns. When j is
NULL (the default) the border is added to the right of every
column, producing a full grid of inner vertical lines.
For the outer edges of the table, use vline_left() and
vline_right() instead; those always target the very first
or very last column.
Usage
vline(x, i = NULL, j = NULL, border = NULL, part = "all")
Arguments
x |
a 'flextable' object, see flextable-package to learn how to create 'flextable' object. |
i |
row selector, see section Row selection with the |
j |
column selector, see section Column selection with the |
border |
border properties defined by a call to
|
part |
part selector, see section Part selection with the |
See Also
Other borders management:
border_inner(),
border_inner_h(),
border_inner_v(),
border_outer(),
border_remove(),
hline(),
hline_bottom(),
hline_top(),
surround(),
vline_left(),
vline_right()
Examples
library(officer)
std_border <- fp_border(color = "orange")
ft <- flextable(head(iris))
ft <- border_remove(x = ft)
# add vertical borders to the right of every column
ft <- vline(ft, border = std_border)
ft
Set the left border of the table
Description
vline_left() draws a vertical line along the left edge
of the table by setting the left border of the first column.
It does not accept a column selector j because it always
targets column 1.
An optional row selector i lets you restrict the line to
specific rows (e.g. only the body, or only certain rows).
Unlike vline(), which adds inner lines to the right of
arbitrary columns, vline_left() is meant for the outer
left edge of the table.
Usage
vline_left(x, i = NULL, border = NULL, part = "all")
Arguments
x |
a 'flextable' object, see flextable-package to learn how to create 'flextable' object. |
i |
row selector, see section Row selection with the |
border |
border properties defined by a call to
|
part |
part selector, see section Part selection with the |
See Also
Other borders management:
border_inner(),
border_inner_h(),
border_inner_v(),
border_outer(),
border_remove(),
hline(),
hline_bottom(),
hline_top(),
surround(),
vline(),
vline_right()
Examples
library(officer)
std_border <- fp_border(color = "orange")
ft <- flextable(head(iris))
ft <- border_remove(x = ft)
# add a border on the left edge of the table
ft <- vline_left(ft, border = std_border)
ft
Set the right border of the table
Description
vline_right() draws a vertical line along the right edge
of the table by setting the right border of the last column.
It does not accept a column selector j because it always
targets the last column.
An optional row selector i lets you restrict the line to
specific rows.
Unlike vline(), which adds inner lines to the right of
arbitrary columns, vline_right() is meant for the outer
right edge of the table.
Usage
vline_right(x, i = NULL, border = NULL, part = "all")
Arguments
x |
a 'flextable' object, see flextable-package to learn how to create 'flextable' object. |
i |
row selector, see section Row selection with the |
border |
border properties defined by a call to
|
part |
part selector, see section Part selection with the |
See Also
Other borders management:
border_inner(),
border_inner_h(),
border_inner_v(),
border_outer(),
border_remove(),
hline(),
hline_bottom(),
hline_top(),
surround(),
vline(),
vline_left()
Examples
library(officer)
std_border <- fp_border(color = "orange")
ft <- flextable(head(iris))
ft <- border_remove(x = ft)
# add a border on the right edge of the table
ft <- vline_right(ft, border = std_border)
ft
Clear the displayed content of selected columns
Description
void() replaces the visible text of the selected columns
with an empty string. The columns themselves (and their
headers) remain in the table, but the cell values are no
longer displayed.
This is useful when a column should stay in the layout
(e.g. to preserve its width or to keep its header label)
but its body values should be hidden, for instance
after using compose() to build a richer display in a
neighbouring column that already incorporates those values.
The underlying dataset is not modified; only the displayed
content is affected. To remove a column entirely, use
the col_keys argument of flextable() instead.
Usage
void(x, j = NULL, part = "body")
Arguments
x |
a 'flextable' object, see flextable-package to learn how to create 'flextable' object. |
j |
column selector, see section Column selection with the |
part |
part selector, see section Part selection with the |
See Also
Other functions to compose cell content:
append_chunks(),
as_paragraph(),
compose(),
footnote(),
labelizor(),
prepend_chunks()
Examples
ftab <- flextable(head(mtcars))
ftab <- void(ftab, ~ vs + am + gear + carb)
ftab
Set columns width
Description
Defines the widths of one or more columns in the
table. This function will have no effect if you have
used set_table_properties(layout = "autofit").
set_table_properties() can provide an alternative to fixed-width layouts
that is supported with HTML and Word output that can be set
with set_table_properties(layout = "autofit").
Usage
width(x, j = NULL, width, unit = "in")
Arguments
x |
a 'flextable' object, see flextable-package to learn how to create 'flextable' object. |
j |
column selector, see section Column selection with the |
width |
width in inches |
unit |
unit for width, one of "in", "cm", "mm". |
Details
Heights are not used when flextable is been rendered into HTML.
See Also
Other functions for flextable size management:
autofit(),
dim.flextable(),
dim_pretty(),
fit_columns(),
fit_to_width(),
flextable_dim(),
height(),
hrule(),
ncol_keys(),
nrow_part(),
set_table_properties()
Examples
ft <- flextable(head(iris))
ft <- width(ft, width = 1.5)
ft
Wrap a flextable for use with patchwork
Description
This function wraps a flextable as a patchwork-compliant patch, similar
to what patchwork::wrap_table() does for gt tables. It allows flextable
objects to be combined with ggplot2 plots in a patchwork layout, with
optional alignment of table headers and body with plot panel areas.
Note this is experimental and may change in the future.
Usage
wrap_flextable(
x,
panel = c("body", "full", "rows", "cols"),
space = c("free", "free_x", "free_y", "fixed"),
n_row_headers = 0L,
flex_body = FALSE,
flex_cols = FALSE,
expand = 0.6,
just = c("left", "right", "center")
)
Arguments
x |
A flextable object. |
panel |
What portion of the table should be aligned with the panel
region? |
space |
How should the dimension of the table influence the final
composition? |
n_row_headers |
Number of leading columns to treat as row headers. These columns will be placed outside the panel region and will not participate in alignment with the plot axes. |
flex_body |
If |
flex_cols |
If |
expand |
Expansion value matching the ggplot discrete axis expansion
( |
just |
Horizontal alignment of the table within its patchwork panel.
One of |
Value
A patchwork-compliant object that can be combined with ggplot2 plots
using +, |, or / operators.
See Also
Other functions for flextable output and export:
df_printer(),
flextable_to_rmd(),
gen_grob(),
htmltools_value(),
knit_print.flextable(),
plot.flextable(),
print.flextable(),
repair_docx(),
save_as_docx(),
save_as_html(),
save_as_image(),
save_as_pptx(),
save_as_rtf(),
to_html.flextable()
Examples
library(gdtools)
font_set_liberation()
library(ggplot2)
library(patchwork)
set_flextable_defaults(
font.family = "Liberation Sans",
font.size = 10,
big.mark = "",
border.color = "grey60"
)
# Adapted from <https://r-graph-gallery.com/web-dumbell-chart.html>
dataset <- data.frame(
team = c(
"FC Bayern Munchen", "SV Werder Bremen", "Borussia Dortmund",
"VfB Stuttgart", "Borussia M'gladbach", "Hamburger SV",
"Eintracht Frankfurt", "FC Schalke 04", "1. FC Koln",
"Bayer 04 Leverkusen"
),
matches = c(2000, 1992, 1924, 1924, 1898, 1866, 1856, 1832, 1754, 1524),
won = c(1206, 818, 881, 782, 763, 746, 683, 700, 674, 669),
lost = c( 363, 676, 563, 673, 636, 625, 693, 669, 628, 447)
)
dataset$win_pct <- dataset$won / dataset$matches * 100
dataset$loss_pct <- dataset$lost / dataset$matches * 100
dataset$team <- factor(dataset$team, levels = rev(dataset$team))
# -- dumbbell chart --
pal <- c(lost = "#EFAC00", won = "#28A87D")
df_long <- reshape(dataset, direction = "long",
varying = list(c("loss_pct", "win_pct")),
v.names = "pct", timevar = "type",
times = c("lost", "won"), idvar = "team"
)
p <- ggplot(df_long, aes(x = pct / 100, y = team)) +
stat_summary(
geom = "linerange", fun.min = "min", fun.max = "max",
linewidth = .7, color = "grey60"
) +
geom_point(aes(fill = type), size = 4, shape = 21,
stroke = .8, color = "white"
) +
scale_x_continuous(
labels = scales::percent,
expand = expansion(add = c(.02, .02))
) +
scale_y_discrete(name = NULL, guide = "none") +
scale_fill_manual(
values = pal,
labels = c(lost = "Lost", won = "Won")
) +
labs(x = NULL, fill = NULL) +
theme_minimal(base_family = "Liberation Sans", base_size = 10) +
theme(
legend.position = "top",
legend.justification = "left",
panel.grid.minor = element_blank(),
panel.grid.major.y = element_blank()
)
# -- flextable --
ft_dat <- dataset[, c("matches", "win_pct", "loss_pct", "team")]
ft_dat$team <- as.character(ft_dat$team)
ft <- flextable(ft_dat)
ft <- border_remove(ft)
ft <- bold(ft, part = "header")
ft <- colformat_double(ft, j = c("win_pct", "loss_pct"),
digits = 1, suffix = "%"
)
ft <- set_header_labels(ft,
team = "Team", matches = "GP",
win_pct = "", loss_pct = ""
)
ft <- color(ft, color = "#28A87D", j = 2)
ft <- color(ft, color = "#EFAC00", j = 3)
ft <- bold(ft, bold = TRUE, j = 2:3)
ft <- italic(ft, italic = TRUE, j = 4)
ft <- align(ft, align = "right", part = "all")
ft <- autofit(ft)
print(
wrap_flextable(ft, flex_body = TRUE, just = "right") +
p + plot_layout(widths = c(1.1, 2))
)