

dplyneage draws interactive column-level lineage diagrams for dplyr
and dbplyr pipelines. Pipe a query into extract_lineage()
and it traces every output column back to the source columns it came
from — through joins, aggregations, CTEs, unions, and computed
expressions — then renders the result as a draggable, zoomable React Flow diagram with
lineage_flow().
dbplyr pipelines are analyzed in pure R by walking their lazy query tree, so no Python is involved. Raw SQL goes through sqlglot’s dedicated lineage engine instead, which means many dialects (DuckDB, PostgreSQL, Snowflake, BigQuery, …) work too.
pak::pak("tgerke/dplyneage")dbplyr pipelines need no Python at all — not even reticulate. For raw
SQL input, install the reticulate package once; the Python dependency
(sqlglot) is then provisioned automatically the first time it’s needed.
See vignette("python-integration") if you manage your own
Python environment.
Build a dplyr pipeline against a database as usual, then pipe it into
extract_lineage() and lineage_flow():
library(dplyneage)
library(dplyr)
library(dbplyr)
library(duckdb)

con <- dbConnect(duckdb::duckdb(), ":memory:")

customers <- tibble(
  customer_id = 1:5,
  first_name = c("Alice", "Bob", "Charlie", "Diana", "Eve"),
  last_name = c("Smith", "Jones", "Brown", "Wilson", "Davis"),
  email = paste0(tolower(first_name), "@example.com")
)

orders <- tibble(
  order_id = 1:10,
  customer_id = rep(1:5, each = 2),
  amount = c(100, 150, 200, 75, 300, 125, 180, 90, 250, 160)
)

copy_to(con, customers, "customers", overwrite = TRUE)
copy_to(con, orders, "orders", overwrite = TRUE)

tbl(con, "customers") |>
  select(customer_id, first_name, last_name, email) |>
  left_join(tbl(con, "orders"), by = "customer_id") |>
  group_by(customer_id, first_name, last_name, email) |>
  summarise(
    total_orders = n_distinct(order_id),
    total_spent = sum(amount, na.rm = TRUE),
    .groups = "drop"
  ) |>
  extract_lineage() |>
  lineage_flow(height = "600px")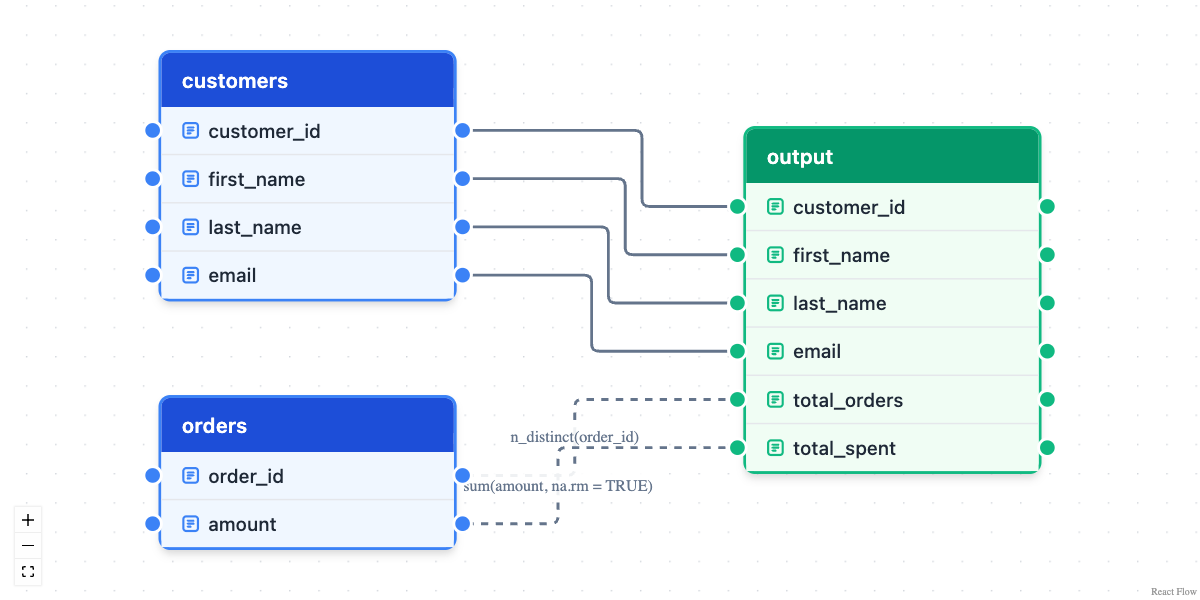
Behind that one pipe, extract_lineage():
dbplyr::sql(), or when you pass a SQL string
directly (that path handles aliases, CTEs, and subqueries, and reads
table schemas from your connection so unqualified columns attribute
correctly)The resulting diagram is fully interactive: drag tables to rearrange, zoom and pan, and hover columns to highlight their connections. Computed columns carry their defining expression as an edge label, and aggregation edges animate.
Lineage extraction needs the lazy query tree that dbplyr builds
before anything executes. A pipeline on a plain tibble has no such tree
— dplyr runs each verb immediately — so extract_lineage()
can’t trace it. The workaround is one line:
dbplyr::memdb_frame() puts the data in a throwaway
in-memory SQLite database and hands back a lazy table, and the identical
pipeline becomes traceable.
sales <- memdb_frame(
  customer_id = c(1, 1, 2),
  amount = c(100, 250, 40),
  .name = "sales"
)

sales |>
  group_by(customer_id) |>
  summarise(total = sum(amount, na.rm = TRUE)) |>
  extract_lineage() |>
  lineage_flow(height = "350px")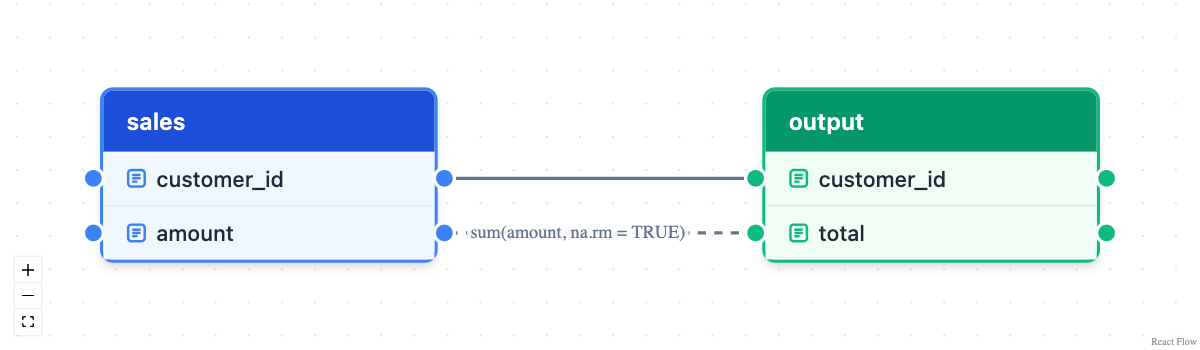
For a data frame you already have,
copy_to(dbplyr::memdb(), df, name = "df") does the same
copy. Lineage depends only on the pipeline’s structure, never on the
data, so for large frames copying a slice is enough —
copy_to(dbplyr::memdb(), head(df), name = "df") yields the
same diagram as copying every row. See the Local
data frames section of the getting-started vignette for more.
Real pipelines materialize layers — bronze tables feed a silver
summary, silver feeds gold. Pass extract_lineage() a named
list, one element per layer, and it stitches them into a single DAG: any
source table whose name matches another element’s name links to that
model’s node.
silver <- tbl(con, "orders") |>
  group_by(customer_id) |>
  summarise(total_spent = sum(amount, na.rm = TRUE), .groups = "drop")
invisible(compute(silver, name = "silver", temporary = TRUE))

gold <- tbl(con, "silver") |>
  mutate(big_spender = total_spent > 400)

extract_lineage(list(silver = silver, gold = gold)) |>
  lineage_flow(height = "450px")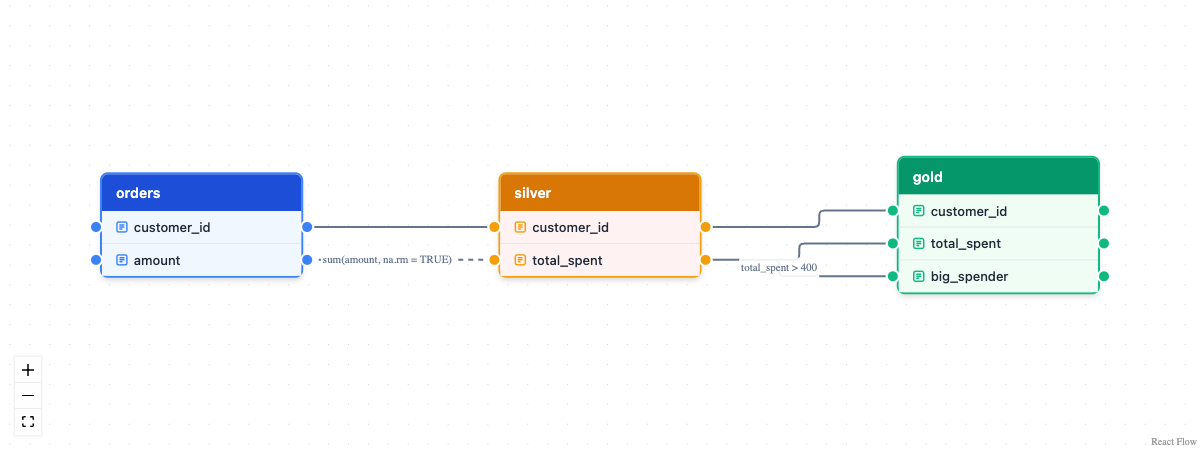
Intermediate models render as orange transform nodes, terminal models as green targets, and impact questions now span the whole pipeline:
extract_lineage(list(silver = silver, gold = gold)) |>
  lineage_upstream("gold.big_spender")
#> [1] "orders.amount" "silver.total_spent"For documentation or design work, you can construct lineage diagrams
directly with create_table_node() and
create_column_edge():
nodes <- list(
  create_table_node(
    table_name = "customers",
    columns = c("customer_id", "name", "email"),
    x = 0, y = 50,
    table_type = "source"
  ),
  create_table_node(
    table_name = "orders",
    columns = c("order_id", "customer_id", "total_amount"),
    x = 0, y = 300,
    table_type = "source"
  ),
  create_table_node(
    table_name = "customer_summary",
    columns = c("customer_id", "customer_name", "total_spent"),
    x = 500, y = 150,
    table_type = "target"
  )
)

edges <- list(
  create_column_edge("customers", "customer_id", "customer_summary", "customer_id"),
  create_column_edge("customers", "name", "customer_summary", "customer_name"),
  create_column_edge("orders", "total_amount", "customer_summary", "total_spent",
                     label = "SUM()", animated = TRUE)
)

lineage_flow(nodes, edges, height = "600px")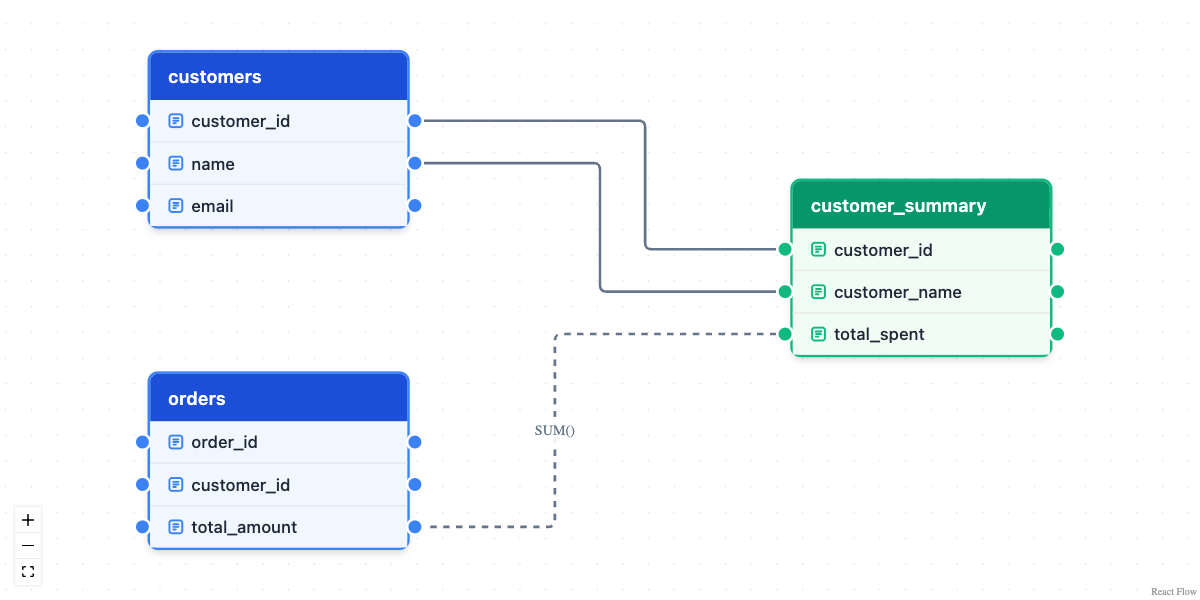
Table types follow the color conventions used by dbt and SQLMesh:
| Type | Color | Use case |
|---|---|---|
source |
Blue | Raw/source tables |
transform |
Orange | Intermediate transformations |
target |
Green | Final output/materialized tables |
Because extract_lineage() accepts any dbplyr lazy table,
it composes directly with packages that produce them — for example ducklake tables:
library(ducklake)

get_ducklake_table("orders") |>
  dplyr::left_join(get_ducklake_table("customers"), by = "customer_id") |>
  dplyr::group_by(customer_id) |>
  dplyr::summarise(total = sum(amount, na.rm = TRUE)) |>
  extract_lineage() |>
  lineage_flow()
The ducklake lineage vignette works through a full example: building a small lake, diagramming each layer of a bronze/silver/gold pipeline, and extracting lineage from time-travel queries.
Diagrams are for people; the same lineage is also useful as plain
data. lineage_edges() flattens it to one classified row per
column edge, and lineage_upstream() /
lineage_downstream() answer impact questions directly:
lineage <- tbl(con, "orders") |>
  left_join(tbl(con, "customers"), by = "customer_id") |>
  group_by(customer_id, first_name) |>
  summarise(total_spent = sum(amount, na.rm = TRUE), .groups = "drop") |>
  extract_lineage()

lineage_edges(lineage)
#>   source_table source_column target_table target_column transformation
#> 1       orders   customer_id       output   customer_id       identity
#> 2    customers    first_name       output    first_name       identity
#> 3       orders        amount       output   total_spent    aggregation
#>                  expression
#> 1               customer_id
#> 2                first_name
#> 3 sum(amount, na.rm = TRUE)

lineage_upstream(lineage, "output.total_spent")
#> [1] "orders.amount"
lineage_diff() compares two extractions — run it across
branches in CI and provenance changes surface before they ship. For
interchange, lineage_json() gives you a small, stable
document you can query with jq, feed to a data catalog, or commit next
to your pipeline code:
lineage_json(lineage)
#> {
#>   "metadata": {
#>     "sql": "SELECT customer_id, first_name, SUM(amount) AS total_spent\nFROM (\n  SELECT orders.*, first_name, last_name, email\n  FROM orders\n  LEFT JOIN customers\n    ON (orders.customer_id = customers.customer_id)\n) AS q01\nGROUP BY customer_id, first_name",
#>     "dialect": "duckdb",
#>     "engine": "r",
#>     "node_count": 3,
#>     "edge_count": 3
#>   },
#>   "nodes": [
#>     {
#>       "id": "orders",
#>       "type": "source",
#>       "columns": ["customer_id", "amount"]
#>     },
#>     {
#>       "id": "customers",
#>       "type": "source",
#>       "columns": ["first_name"]
#>     },
#>     {
#>       "id": "output",
#>       "type": "target",
#>       "columns": ["customer_id", "first_name", "total_spent"]
#>     }
#>   ],
#>   "edges": [
#>     {
#>       "source": "orders",
#>       "source_column": "customer_id",
#>       "target": "output",
#>       "target_column": "customer_id",
#>       "transformation": "identity",
#>       "expression": "customer_id"
#>     },
#>     {
#>       "source": "customers",
#>       "source_column": "first_name",
#>       "target": "output",
#>       "target_column": "first_name",
#>       "transformation": "identity",
#>       "expression": "first_name"
#>     },
#>     {
#>       "source": "orders",
#>       "source_column": "amount",
#>       "target": "output",
#>       "target_column": "total_spent",
#>       "transformation": "aggregation",
#>       "expression": "sum(amount, na.rm = TRUE)"
#>     }
#>   ]
#> }
Written to a file, that document is scriptable from outside R
entirely — here’s jq answering “which source columns feed
total_spent?”:
lineage_json(lineage, "lineage.json")jq -r '.edges[] | select(.target_column == "total_spent")
| "\(.source).\(.source_column)"' lineage.json
#> orders.amountlineage_graphml() writes GraphML, which opens directly
in graph tools like Gephi, yEd, and igraph. The same question works as a
graph query — and scales to transitive ancestry when pipelines
chain:
path <- tempfile(fileext = ".graphml")
lineage_graphml(lineage, path)

g <- igraph::read_graph(path, format = "graphml")
igraph::subcomponent(g, "output.total_spent", mode = "in")
#> + 2/6 vertices, named, from fb656f2:
#> [1] output.total_spent orders.amountvignette("getting-started") walks from a first diagram
through CTEs, multi-source columns, and schemasvignette("python-integration") covers how the Python
dependency is managed