![]()
![]()
The goal of designit is to generate optimal sample allocations for experimental designs.
You can install the development version from GitHub with:
# install.packages("devtools")
devtools::install_github("BEDApub/designit")
The main class used is BatchContainer, which holds the
dimensions for sample allocation. After creating such a container, a
list of samples can be allocated in it using a given assignment
function.
library(tidyverse)
library(designit)

data("longitudinal_subject_samples")

# we use a subset of longitudinal_subject_samples data
subject_data <- longitudinal_subject_samples %>%
  filter(Group %in% 1:5, Week %in% c(1,4)) %>%
  select(SampleID, SubjectID, Group, Sex, Week) %>%
  # with two observations per patient
  group_by(SubjectID) %>%
  filter(n() == 2) %>%
  ungroup() %>%
  select(SubjectID, Group, Sex) %>%
  distinct()

head(subject_data)
#> # A tibble: 6 × 3
#>   SubjectID Group Sex
#>   <chr>     <chr> <chr>
#> 1 P01       1     F
#> 2 P02       1     M
#> 3 P03       1     M
#> 4 P04       1     F
#> 5 P19       1     M
#> 6 P20 1 FBatchContainer and assigning samples# a batch container with 3 batches and 11 locations per batch
bc <- BatchContainer$new(
dimensions = list("batch" = 3, "location" = 11),
)
# assign samples randomly
set.seed(17)
bc <- assign_random(bc, subject_data)
bc$get_samples() %>%
ggplot() +
aes(x = batch, fill = Group) +
geom_bar()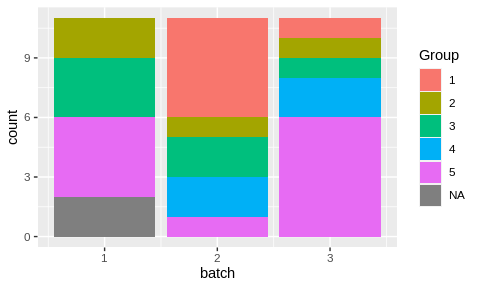
Random assignmet of samples to batches produced an uneven distribution.
# set scoring functions
scoring_f <- list(
  # first priority, groups are evenly distributed
  group = osat_score_generator(batch_vars = "batch",
                               feature_vars = "Group"),
  # second priority, sexes are evenly distributed
  sex = osat_score_generator(batch_vars = "batch",
                             feature_vars = "Sex")
)

bc <- optimize_design(
  bc, scoring = scoring_f, max_iter = 150, quiet = TRUE
)

bc$get_samples() %>%
  ggplot() +
  aes(x = batch, fill = Group) +
  geom_bar()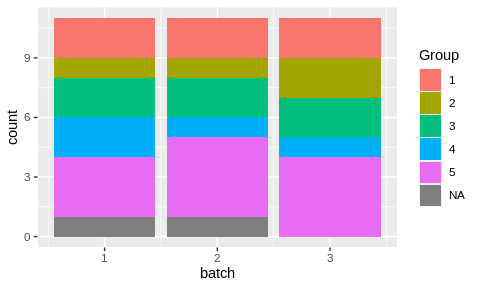
# show optimization trace
bc$plot_trace()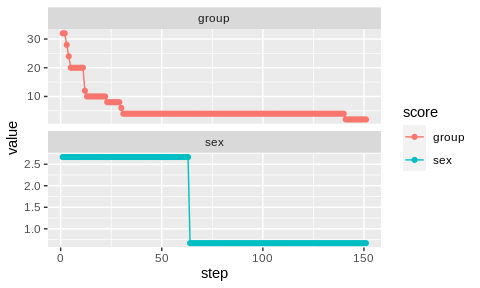
See vignettes vignette("basic_examples").
The logo is inspired by DALL-E 2 and pipette icon by gsagri04.