The ctlr package implements clinical tolerance limits (CTL) methodology for assessing agreement between two measurement methods. It estimates the true latent trait using Best Linear Unbiased Predictors (BLUP), models bias and variance components, and calculates overall and conditional agreement probabilities.
ctl_dataset1 and
ctl_dataset2) included for demonstrationYou can install the ctlr package from CRAN:
install.packages("ctlr")You can install the development version of ctlr from GitHub with:
# install.packages("devtools")
devtools::install_github("elianemaalouf/ctlr")Basic usage examples:
library(ctlr)
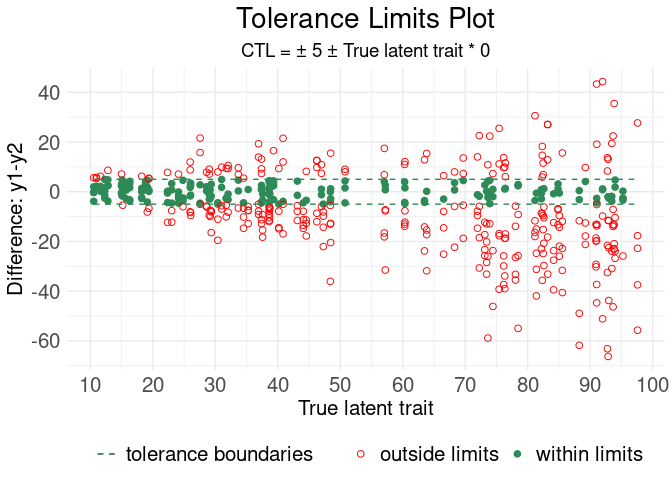
# Example with tolerance limit plot
ctl(
ctl_dataset1,
idvar = "id",
ynew = "y1",
yref = "y2",
intercept = 5,
slope = 0,
tlplot = TRUE
)
#>
#> Use of Clinical Tolerance Limits (CTL) for assessing agreement
#> **************************************************************
#> ID Variable: id
#> New Method Y Variable: y1
#> Reference Method Y Variable: y2
#> Running...
#> seed set to 123456789
#> Constant tolerance limits specified: intercept= 5& slope= 0
#> Estimating BLUP for latent trait...
#> diff_bias= 3.348273 , 95%CI=[ 1.60864 ; 5.087905 ]
#> prop_bias= 0.833226 , 95%CI=[ 0.7876876 ; 0.8787644 ]
#>
#> Generating Tolerance Limits Plot
#> **************************************************************
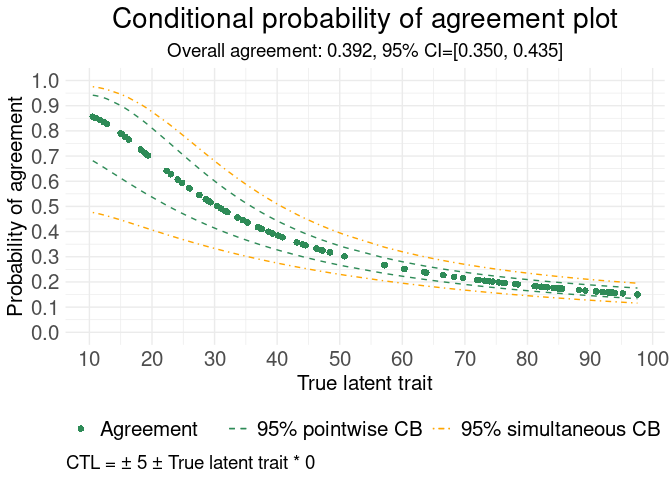
# Example with conditional probability of agreement plot
ctl(
  ctl_dataset1,
  idvar = "id",
  ynew = "y1",
  yref = "y2",
  intercept = 5,
  slope = 0,
  cpaplot = TRUE
)
#>
#> Use of Clinical Tolerance Limits (CTL) for assessing agreement
#> **************************************************************
#> ID Variable: id
#> New Method Y Variable: y1
#> Reference Method Y Variable: y2
#> Running...
#> seed set to 123456789
#> Constant tolerance limits specified: intercept= 5& slope= 0
#> Estimating BLUP for latent trait...
#> diff_bias= 3.348273 , 95%CI=[ 1.60864 ; 5.087905 ]
#> prop_bias= 0.833226 , 95%CI=[ 0.7876876 ; 0.8787644 ]
#> Number of simulations used for CPA plot is set to 1000
#>
#> Generating Conditional probability of agreement plot
#> **************************************************************
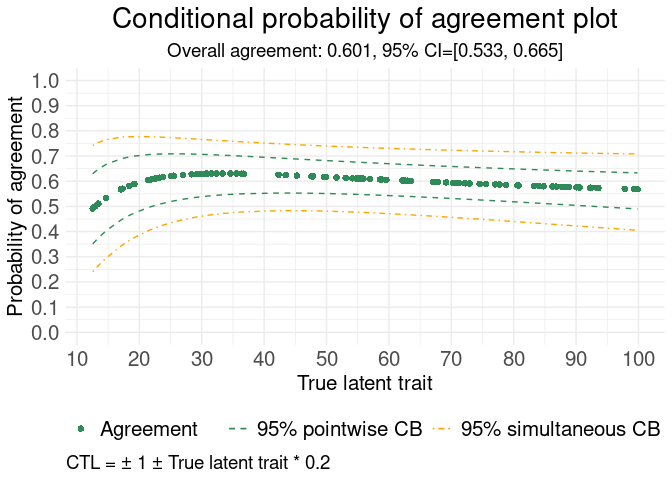
# Example with non-constant tolerance limits
ctl(
  ctl_dataset2,
  idvar = "id",
  ynew = "y1",
  yref = "y2",
  intercept = 1,
  slope = 0.2,
  seed = 11446158,
  cpaplot = TRUE
)
#>
#> Use of Clinical Tolerance Limits (CTL) for assessing agreement
#> **************************************************************
#> ID Variable: id
#> New Method Y Variable: y1
#> Reference Method Y Variable: y2
#> Running...
#> seed set to 11446158
#> Non-constant tolerance limits specified: intercept= 1& slope= 0.2
#> Estimating BLUP for latent trait...
#> diff_bias= 5.142302 , 95%CI=[ 2.599347 ; 7.685256 ]
#> prop_bias= 0.7953882 , 95%CI=[ 0.7347545 ; 0.856022 ]
#> Number of simulations used for CPA plot is set to 1000
#>
#> Generating Conditional probability of agreement plot
#> **************************************************************
The methodology implemented in this package is based on:
Taffé P. (2016) “Effective plots to assess bias and precision in method comparison studies” Statistical Methods in Medical Research, 27(6), 1650-1660. https://doi.org/10.1177/0962280216666667
Taffé P. (2019) “Assessing bias, precision, and agreement in method comparison studies” Statistical Methods in Medical Research, 29(3), 778-796. https://doi.org/10.1177/0962280219844535
Taffé, P. (2025). “ctl: A package for assessing agreement based on clinical tolerance limits” The Stata Journal, 25(3), 659–676. https://doi.org/10.1177/1536867X251365501
GPL(>=3)