
![]()
![]()
This is an R wrapper around the COVID Tracking Project API. It provides updates on the spread of the virus in the US with a few simple functions.
install.packages("covid19us")Or the dev version:
devtools::install_github("aedobbyn/covid19us")library(covid19us)Get the most recent COVID-19 top-line data for the country:
get_us_current()
#> # A tibble: 1 x 18
#>   positive negative pending hospitalized_cu… hospitalized_cu… in_icu_currently
#>      <int>    <int>   <int>            <int>            <int>            <int>
#> 1  1520778 10713209    2944            41174           159634             9829
#> # … with 12 more variables: in_icu_cumulative <int>,
#> #   on_ventilator_currently <int>, on_ventilator_cumulative <int>,
#> #   recovered <int>, hash <chr>, last_modified <chr>, death <int>,
#> #   hospitalized <int>, total <int>, total_test_results <int>, notes <chr>,
#> #   request_datetime <dttm>
Or the same by state:
get_states_current()
#> # A tibble: 56 x 30
#>    state positive positive_score negative_score negative_regula…
#>    <chr>    <int>          <int>          <int>            <int>
#>  1 AK         399              1              1                1
#>  2 AL       12376              1              1                0
#>  3 AR        4923              1              1                1
#>  4 AZ       14566              1              1                0
#>  5 CA       81795              1              1                0
#>  6 CO       22202              1              1                1
#>  7 CT       38430              1              1                1
#>  8 DC        7434              1              1                1
#>  9 DE        8037              1              1                1
#> 10 FL       46944              1              1                1
#> # … with 46 more rows, and 25 more variables: commercial_score <int>,
#> #   grade <chr>, score <int>, notes <chr>, data_quality_grade <chr>,
#> #   negative <int>, pending <int>, hospitalized_currently <int>,
#> #   hospitalized_cumulative <int>, in_icu_currently <int>,
#> #   in_icu_cumulative <int>, on_ventilator_currently <int>,
#> #   on_ventilator_cumulative <int>, recovered <int>, last_update <dttm>,
#> #   check_time <dttm>, death <int>, hospitalized <int>, total <int>,
#> #   total_test_results <int>, fips <chr>, date_modified <dttm>,
#> #   date_checked <dttm>, hash <chr>, request_datetime <dttm>
Daily state counts can be filtered by state and/or date:
get_states_daily(
  state = "NY",
  date = "2020-03-17"
)
#> # A tibble: 1 x 27
#>   date       state positive negative pending hospitalized_cu… hospitalized_cu…
#>   <date>     <chr>    <int>    <int>   <int>            <int>            <int>
#> 1 2020-03-17 NY        1700     5506      NA              325               NA
#> # … with 20 more variables: in_icu_currently <int>, in_icu_cumulative <int>,
#> #   on_ventilator_currently <int>, on_ventilator_cumulative <int>,
#> #   recovered <int>, data_quality_grade <chr>, last_update <dttm>, hash <chr>,
#> #   date_checked <dttm>, death <int>, hospitalized <int>, total <int>,
#> #   total_test_results <int>, fips <chr>, death_increase <int>,
#> #   hospitalized_increase <int>, negative_increase <int>,
#> #   positive_increase <int>, total_test_results_increase <int>,
#> #   request_datetime <dttm>
For data in long format:
(dat <- refresh_covid19us())
#> # A tibble: 80,123 x 7
#>    date       location location_type location_code location_code_t… data_type
#>    <date>     <chr>    <chr>         <chr>         <chr>            <chr>
#>  1 2020-05-19 AK       state         02            fips_code        positive
#>  2 2020-05-19 AK       state         02            fips_code        negative
#>  3 2020-05-19 AK       state         02            fips_code        pending
#>  4 2020-05-19 AK       state         02            fips_code        hospital…
#>  5 2020-05-19 AK       state         02            fips_code        hospital…
#>  6 2020-05-19 AK       state         02            fips_code        in_icu_c…
#>  7 2020-05-19 AK       state         02            fips_code        in_icu_c…
#>  8 2020-05-19 AK       state         02            fips_code        on_venti…
#>  9 2020-05-19 AK       state         02            fips_code        on_venti…
#> 10 2020-05-19 AK       state         02            fips_code        recovered
#> # … with 80,113 more rows, and 1 more variable: value <int>
Which can be easier to plot
library(dplyr)
library(ggplot2)

dat %>%
  filter(
    location == "NY" &
      data_type %in%
      c(
        "positive_increase",
        "total_test_results_increase",
        "death_increase",
        "hospitalized_increase"
      )
  ) %>%
  mutate(
    Type = data_type %>%
      stringr::str_replace_all("_", " ") %>%
      stringr::str_to_title()
  ) %>%
  arrange(date) %>%
  ggplot(aes(date, value, color = Type)) +
  geom_smooth(se = FALSE) +
  scale_x_date(date_breaks = "2 weeks") +
  labs(title = "COVID in NY") +
  xlab("Date") +
  ylab("Value") +
  theme_minimal(base_family = "Source Sans Pro")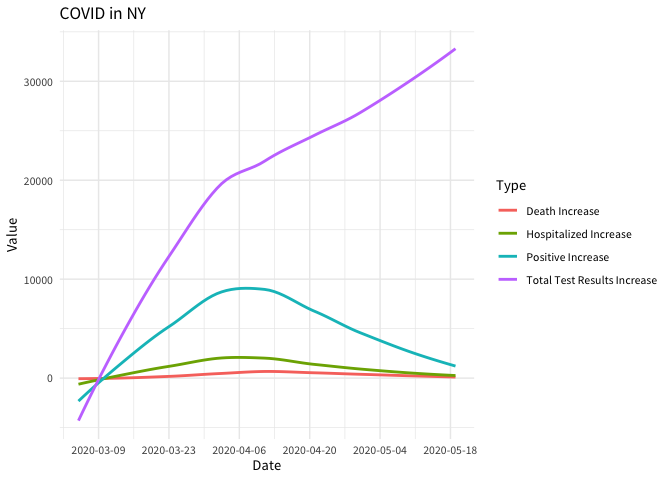
To get information about the data:
get_info_covid19us()
#> # A tibble: 1 x 10
#>   data_set_name package_name function_to_get… data_details data_url license_url
#>   <chr>         <chr>        <chr>            <chr>        <chr>    <chr>
#> 1 covid19us     covid19us    refresh_covid19… Open Source… https:/… https://gi…
#> # … with 4 more variables: data_types <chr>, location_types <chr>,
#> # spatial_extent <chr>, has_geospatial_info <lgl>get_counties_info
get_info_covid19us
get_states_current
get_states_daily
get_states_info
get_tracker_urls
get_us_current
get_us_daily
refresh_covid19usAll of the data sources can be found with
get_tracker_urls()
filter column gives information about how the COVID Tracking
Project’s scraper currently scrapes data from the page (xpaths, CSS
selectors, functions used, etc.)State breakdowns include DC as well as some US territories including American Samoa (AS), Guam (GU), Northern Mariana Islands (MP), Puerto Rico (PR), and the Virgin Islands (VI)
Acronyms
Time zone used is Eastern Standard Time
PRs and bug reports / feature requests welcome. Stay safe!