![]()
![]()
![]()
![]()
{clinify} is direct extension of the {flextable} and {officer} packages, aimed at supplementing some functionality and simplifying some common tasks in the creation of clinical tables, listings, and figures.
You can install the development version of {clinify} like so:
install.packages("clinify")

# Install the development version:
devtools::install_github(
  "https://github.com/atorus-research/clinify.git",
  ref = "development"
)There’s a large assortment of table packages available, and many are specifically catered to clinical reporting. For many organizations, one of these packages may very well be a great choice, but there are a couple of key motivators we’ve found that drove us to start writing {clinify}:
Instead of building a new package from the ground up, {clinify} aims to extend what we see as a best choice for the situation at hand, adding new functionality where necessary and streamlining common tasks to make them more efficient for programmers to implement. We chose {flextable} for a two key reasons:
{flextable} already offers most of the functionality that we’re looking for, particularly with the pairing of {officer}. For example, word documents have to be a first class priority of output support.
While creating a table is the focus, the output tends to be more than just a table. We need the capability to modify the underlying document as a whole, which is another place that {officer} is truly necessary.
Here are some key principles we’re using in building {clinify}:
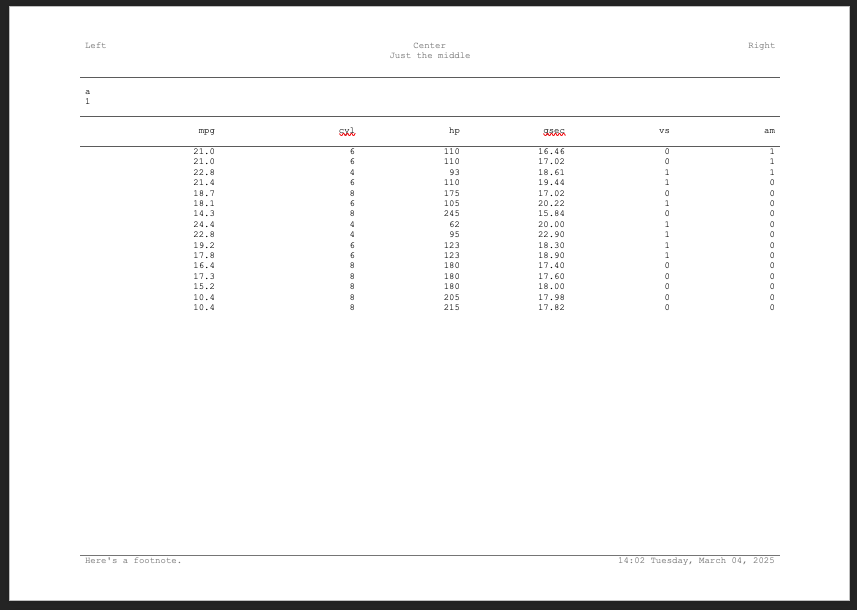
Here’s a basic example of some of clinify’s benefit in action
library(clinify)
# Mock some data
dat <- mtcars
dat["page"] <- c(
  rep(1, 10),
  rep(2, 10),
  rep(3, 10),
  c(4, 4)
)
dat2 <- rbind(dat, dat)
dat2["groups"] <- c(
  rep("a", 32),
  rep("b", 32)
)

# Create a basic table
ct <- clintable(dat2) |>
  # Break pages by the "page" variable
  clin_page_by("page") |>
  # Add header lines using the "groups" variable
  clin_group_by("groups") |>
  # For overflowing columns, alternate pages with
  # fixed variables for each page
  clin_alt_pages(
    key_cols = c("mpg", "cyl", "hp"),
    col_groups = list(
      c("disp", "drat", "wt"),
      c("qsec", "vs", "am"),
      c("gear", "carb")
    )
  ) |>
  # Apply column widths as a proportion of the total page
  # For alternating pages, the proportion allocated to key columns
  # is carried to each page group
  clin_col_widths(mpg = .2, cyl = .2, disp = .15, vs = .15) |>
  # Add titles here is using new_header_footer to allow flextable functions
  # to customize the titles block
  clin_add_titles(
    list(
      c("Left", "Right"),
      c("Just the middle")
    )
  ) |>
  clin_add_footnotes(
    list(
      c(
        "Here's a footnote.",
        format(Sys.time(), "%H:%M %A, %B %d, %Y")
      )
    )
  )

# Print pages (by default 3 pages) to the viewer of the IDE
print(ct)
Built off {flextable} and {officer}, you can then write the table out to a docx file.
# Write the table out to docx
write_clindoc(ct, "demo_table.docx")