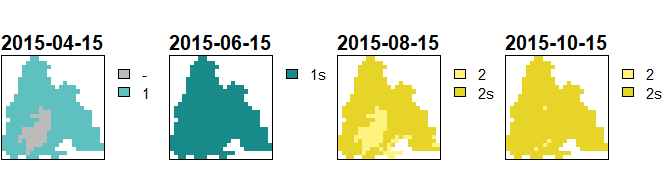
Generations plot (“1” means that the first generation hatched, “1s” means that the first generations sister brood hatched)
The goal of barrks (bark beetle
raster kit for
seasonal development) is to calculate the phenological
development of bark beetles. Rather than implementing one specific
model, the package provides a collection of different models that can be
chosen. Additionally, the models can be customized and combined to
create an individual model. The calculations can be done spatially
explicit by using raster inputs, or based on station inputs that are
available as data frames. Even though most of the implemented models
describe the phenology of Ips typographus, the package is not
limited to particular bark beetle species. For instance, CHAPY models
the phenology of Pityogenes chalcographus and the package may
be extended by models for additional bark beetle species. The full
documentation of barrks can be found here.
The following table lists the models that are implemented in the package.
| Model | Publication | Species | Help |
|---|---|---|---|
| BSO | Jakoby, Lischke, and Wermelinger (2019) | I. typographus | ?model.bso.apply ?model.bso.customize |
| Lange | Lange, Økland, and Krokene (2008) | I. typographus | ?model.lange.apply ?model.lange.customize |
| Jönsson | Jönsson et al. (2011) | I. typographus | ?model.joensson.apply ?model.joensson.customize |
| PHENIPS | Baier, Pennerstorfer, and Schopf (2007) | I. typographus | ?model.phenips.apply ?model.phenips.customize |
| PHENIPS‑Clim | - | I. typographus | ?model.phenips_clim.apply ?model.phenips_clim.customize |
| RITY | Ogris et al. (2019) | I. typographus | ?model.rity.apply ?model.rity.customize |
| CHAPY | Ogris et al. (2020) | P. chalcographus | ?model.chapy.apply ?model.chapy.customize |
The latest released version of barrks can be installed
from CRAN from within R:
install.packages('barrks')The development version of barrks can be installed from
GitHub:
devtools::install_github("jjentschke/barrks")barrks comes with sample data that will be used below.
The phenology is calculated with phenology() which takes
all necessary inputs as arguments. Subsequently, the rasters of emerged
generations by date can be retrieved with
get_generations_rst(). terra::plot() can be
used to visualize these rasters.
library(barrks)
library(tidyverse)
library(terra)


# calculate phenology
pheno <- phenology('phenips-clim', barrks_data())

# plot number of prevailing generations on 4 different dates
dates <- c('2015-04-15', '2015-06-15', '2015-08-15', '2015-10-15')
get_generations_rst(pheno, dates) %>% plot(mar = c(0.2, 0.1, 2, 5),
                                           axes = FALSE, box = TRUE, nr = 1,
                                           cex.main = 1.9, plg = list(cex = 1.8))
Generations plot (“1” means that the first generation hatched, “1s” means that the first generations sister brood hatched)
barrks makes it easy to plot the development of the
individual generations. To illustrate that, a “shaded” variant of the
phenology above is calculated and the development diagram for a specific
cell (called “station” in barrks) is plotted for both
phenology variants.
pheno_shaded <- phenology('phenips-clim', barrks_data(), exposure = 'shaded')

plot_development_diagram(list(sunny = pheno, shaded = pheno_shaded),
                         stations_create('Example', 234),
                         .lty = c(1, 2),
                         xlim = as.Date(c('2015-04-01', '2015-12-31')))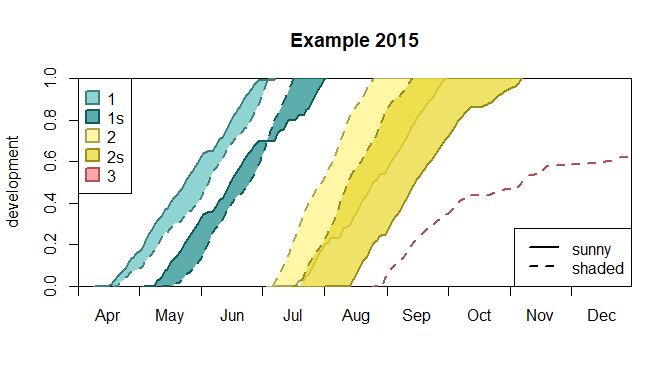
Development diagram