A tidy and flexible framework for visualizing multivariate ordinations in R
![]()
![]()
barrel is an R package that enhances the visualization
of ordination analyses (e.g. NMDS, RDA, dbRDA) using
ggplot2. It provides a modular set of tools to add
ellipses, centroids, environmental vectors, and annotations — all
compatible with tidyverse workflows.
install.packages("barrel")# install.packages("devtools")
devtools::install_github("BarrancoElena/barrel")library(vegan)
library(barrel)
library(ggplot2)
data(dune)
data(dune.env)
ord <- metaMDS(dune)
ord <- barrel_prepare(ord, dune.env)
autoplot(ord, group = "Management", data = dune)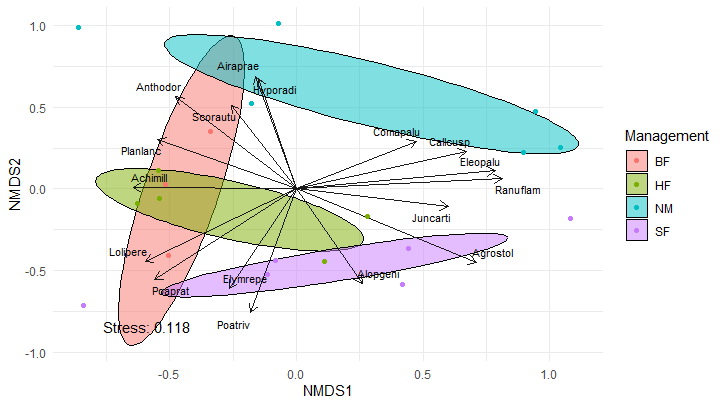
autoplot(): single-function plotting of NMDS, RDA,
dbRDA, CCA, etc.method = "classic" and
"robust" covariance estimationstat_barrel()), centroids
(stat_barrel_centroid()), vectors
(stat_barrel_arrows())stat_barrel_annotate()ggplot2 syntaxA full user guide is available:
browseVignettes("barrel")Diego Barranco-Elena
@BarrancoElena
MIT © 2025 Diego Barranco-Elena