
![]()
![]()
![]()
![]()
An
ShinyApp for Exploring scRNA-seq Data Processed inSeurat
A simple, one-command package which runs an interactive dashboard
capable of common visualizations for single cell RNA-seq.
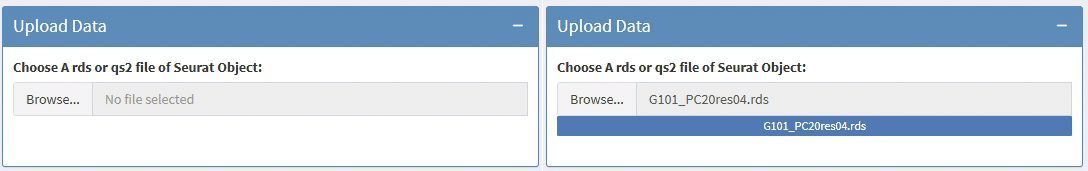
SeuratExplorer requires a processed Seurat
object, which is saved as rds or qs2 file.
Currently, there is still no good tools for visualising the analysis results from
Seurat, when the bioinformatics analyst hands over the results to the user, if the user does not have any R language foundation, it is still difficult to retrieve the results and re-analysis on their own, and this R package is designed to help such users to visualize and explore the anaysis results. The only thing to do for such users is to configure R and Rstudio on their own computers, and then installSeuratExplorer, without any other operations, an optional way is to upload theSeurat objectfile to a server which has been deployed withshinyserverandSeuratExplorer.
Essentially, what
SeuratExplorerdone is just to perform visual operations for command line tools fromSeurator other packages.
Install the latest version from github - Recommended:
if(!require(devtools)){install.packages("devtools")}
install_github("fentouxungui/SeuratExplorer", dependencies = TRUE)
Or install from CRAN:
# Install non-CRAN dependencies first
if (!require("BiocManager", quietly = TRUE)){
  install.packages("BiocManager")
}
BiocManager::install(c("ComplexHeatmap", "MAST", "limma", "DESeq2"))

# Install presto from GitHub
if(!require(devtools)){
  install.packages("devtools")
}
devtools::install_github("immunogenomics/presto")

# Install SeuratExplorer from CRAN
install.packages("SeuratExplorer")
System Requirements:
library(SeuratExplorer)
launchSeuratExplorer()
You can customize the launch behavior with additional parameters:
verbose: Set to TRUE for debug messages
(default: FALSE)ReductionKeyWords: Keywords for dimension reduction
options (default: c("umap","tsne"))SplitOptionMaxLevel: Maximum levels for split options
(default: 12)MaxInputFileSize: Maximum upload file size in bytes
(default: 20*1024^3, i.e., 20GB)# Example with custom parameters
launchSeuratExplorer(
verbose = TRUE,
ReductionKeyWords = c("umap", "tsne", "pca"),
MaxInputFileSize = 10*1024^3 # 10GB
)Besides the interactive Shiny app, SeuratExplorer
provides several utility functions that can be used in R scripts:
launchSeuratExplorer(): Launch the interactive Shiny
applicationgetColors(): Get color palettes for visualizationcellRatioPlot(): Create stacked bar plots showing cell
type proportions across samplestop_genes(): Find top expressed genes by cell
clusterFor advanced users who want to customize the Shiny app:
ui() / server(): Main UI and server
functionsexplorer_body_ui() /
explorer_sidebar_ui(): Modular UI componentsexplorer_server(): Modular server functionSee function documentation for detailed usage examples.
You can deploy this app on a shiny server, which allows people to view their data on a webpage by uploading the data to server.
A live demo: Upload an Rds or qs2 file, with file size no more than 20GB, to Demo Site. You can download a mini demo data from github.
# app.R
library(SeuratExplorer)
launchSeuratExplorer()The Assay class stores single cell data. For typical scRNA-seq experiments, a Seurat object will have a single Assay (“RNA”). This assay will also store multiple ‘transformations’ of the data, including raw counts (@counts slot), normalized data (@data slot), and scaled data for dimensional reduction (@scale.data slot).
SeuratExplorer allows for assay switching, thereby multiple data types can be supported, including:
Single-cell Modalities:
Normalization Methods:
Assay Slots:
Different visualization features support different assay slots:
counts,
data, scale.datacounts,
data, scale.datadata slotdata,
scale.datacounts,
data, scale.datacounts,
datacounts (by accumulation) or any slot (by cell)datadatasupport Seurat object saved as .rds or
.qs2 file.
support data processed by Seurat V5 and older
versions. it may takes a while to update Seurat object when
loading data.
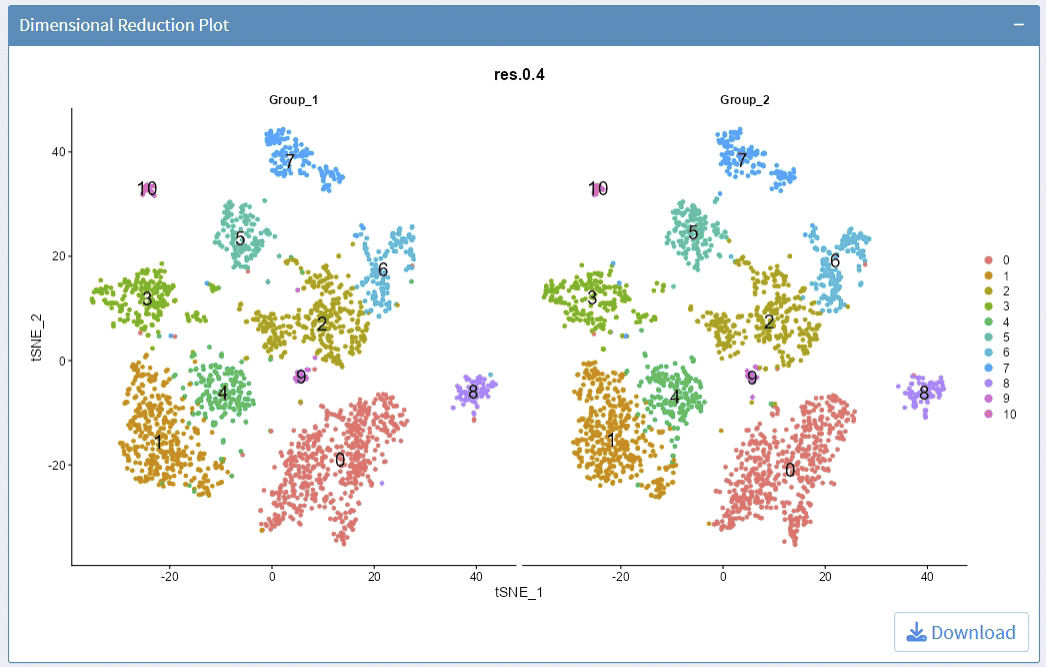
support options for Dimension Reductions
support options for Cluster Resolution
support split plots
support highlight selected clusters
support adjust the height/width ratio of the plot
support options for showing cluster label
support adjust label size
support adjust point size
support download plot in pdf format, what you see is what you get
Example plots:
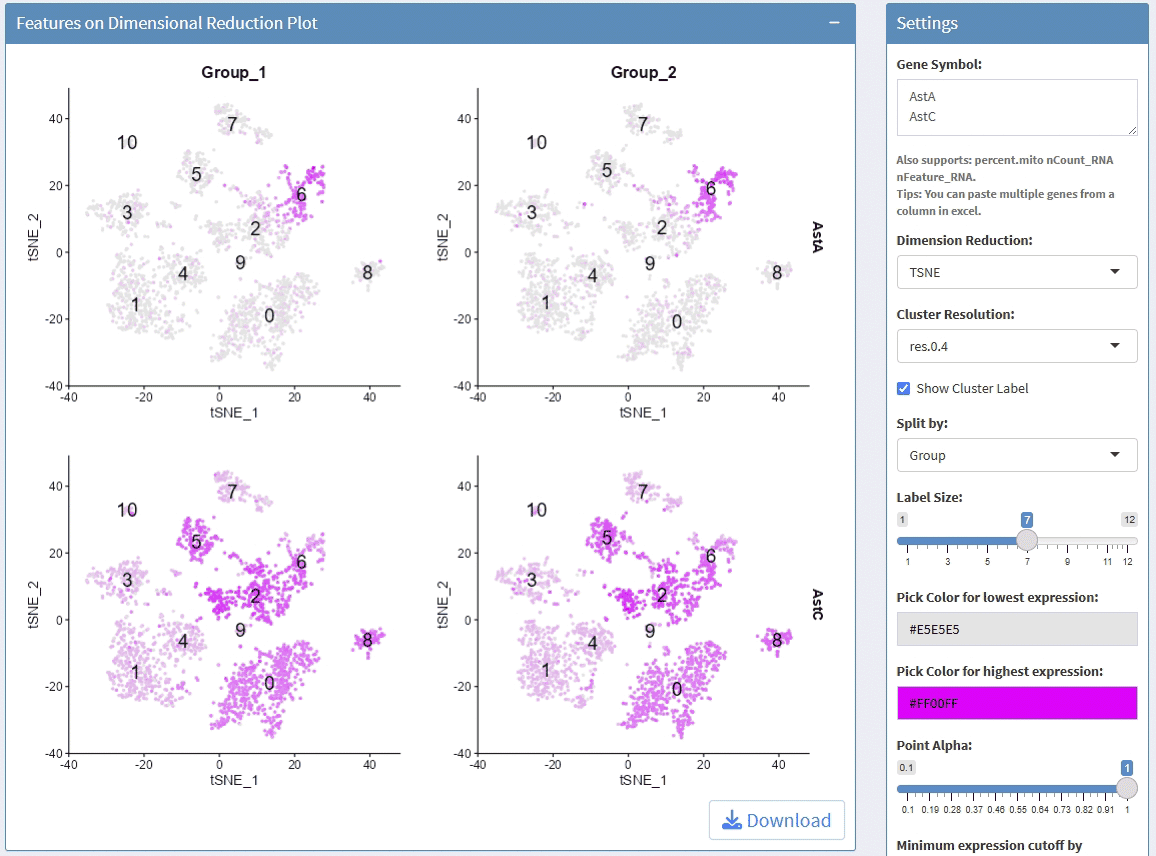
support display multiple genes simultaneous, genes names are case-insensitive. Tips: paste multiple genes from excel
support options for Dimension Reductions
support split plots
support change colors for the lowest expression and highest expression
support adjust the height/width ratio of the plot
support adjust point size
support download plot in pdf format, what you see is what you get
support switch Assays which contain any one of the slots: counts, data, scale.data
Example plots:
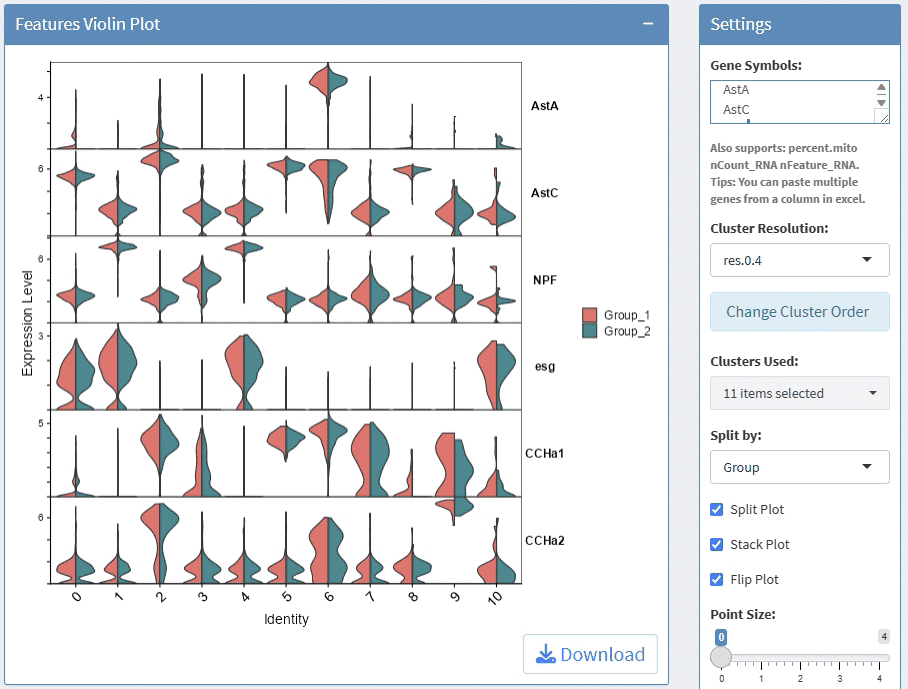
support display multiple genes simultaneous, genes names are case-insensitive. Tips: paste multiple genes from excel
support options for Cluster Resolution
support split plots
support stack and flip plot, and color mapping selection.
support adjust point size and transparency
support adjust font size on x and y axis
support adjust the height/width ratio of the plot
support download plot in pdf format, what you see is what you get
support switch Assays which contain any one of the slots: counts, data, scale.data
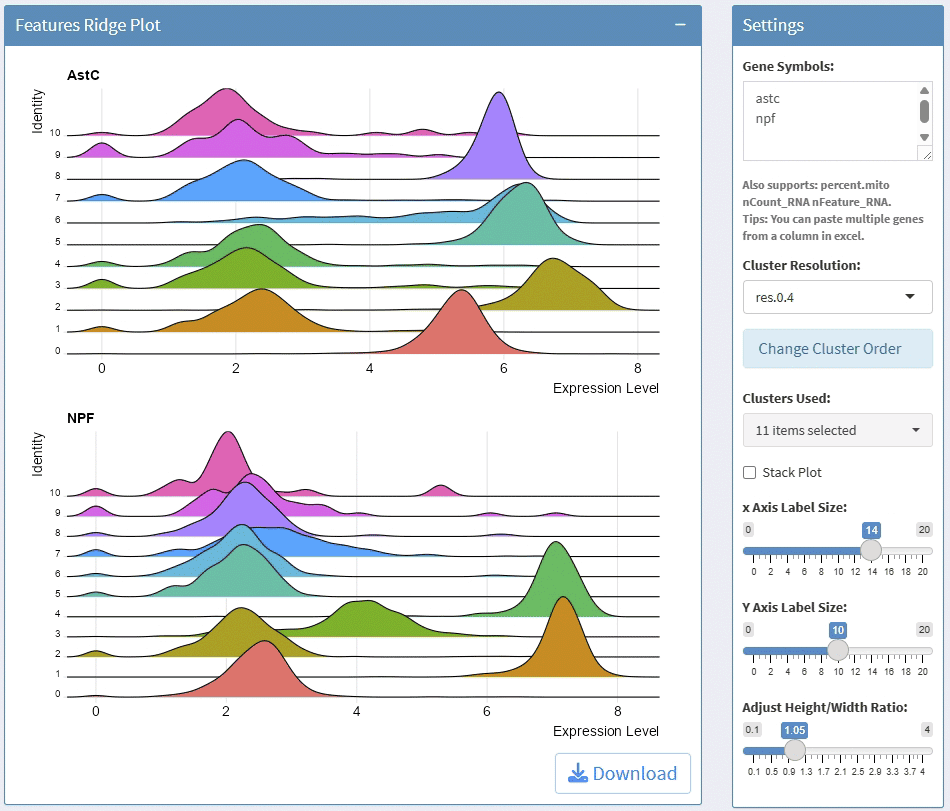
Example plots:
support display multiple genes simultaneous, genes names are case-insensitive. Tips: paste multiple genes from excel
support options for Cluster Resolution and subset clusters
support split plots
support cluster clusters
support rotate axis and flip coordinate
support adjust point size and transparency
support adjust font size on x and y axis
support adjust the height/width ratio of the plot
support download plot in pdf format, what you see is what you get
support switch Assays which contain slot: data
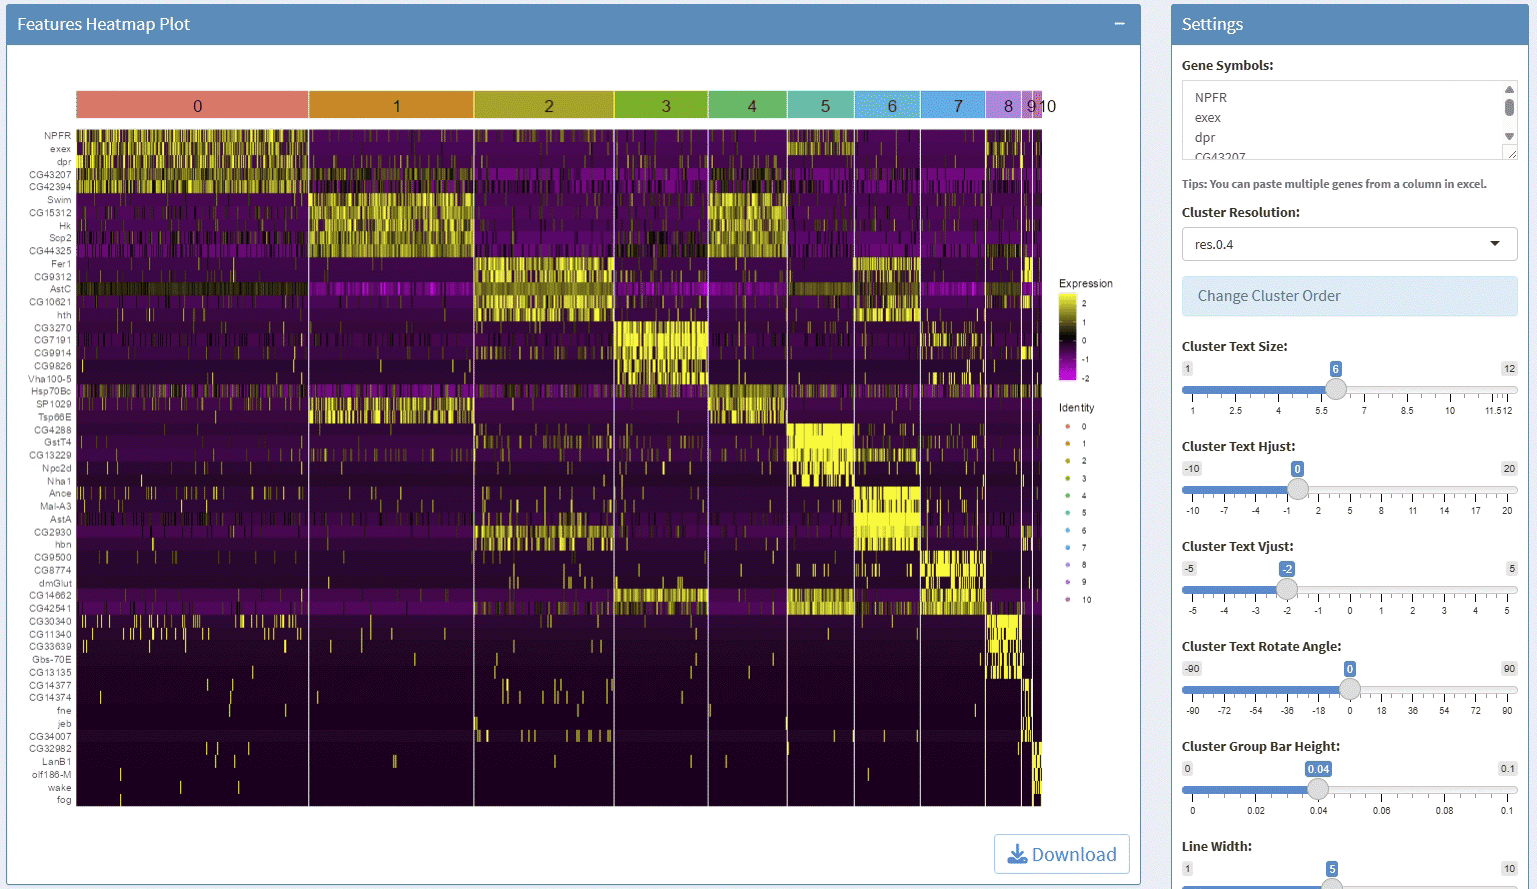
Example plots:
support display multiple genes simultaneous, genes names are case-insensitive. Tips: paste multiple genes from excel
support options for Cluster Resolution and reorder clusters
support adjust font size and rotation angle of cluster label, and flip coordinate
support adjust the height of group bar
support adjust the gap size between groups
support adjust the font size of gene names
support adjust the height/width ratio of the plot
support download plot in pdf format, what you see is what you get
support Assay switch
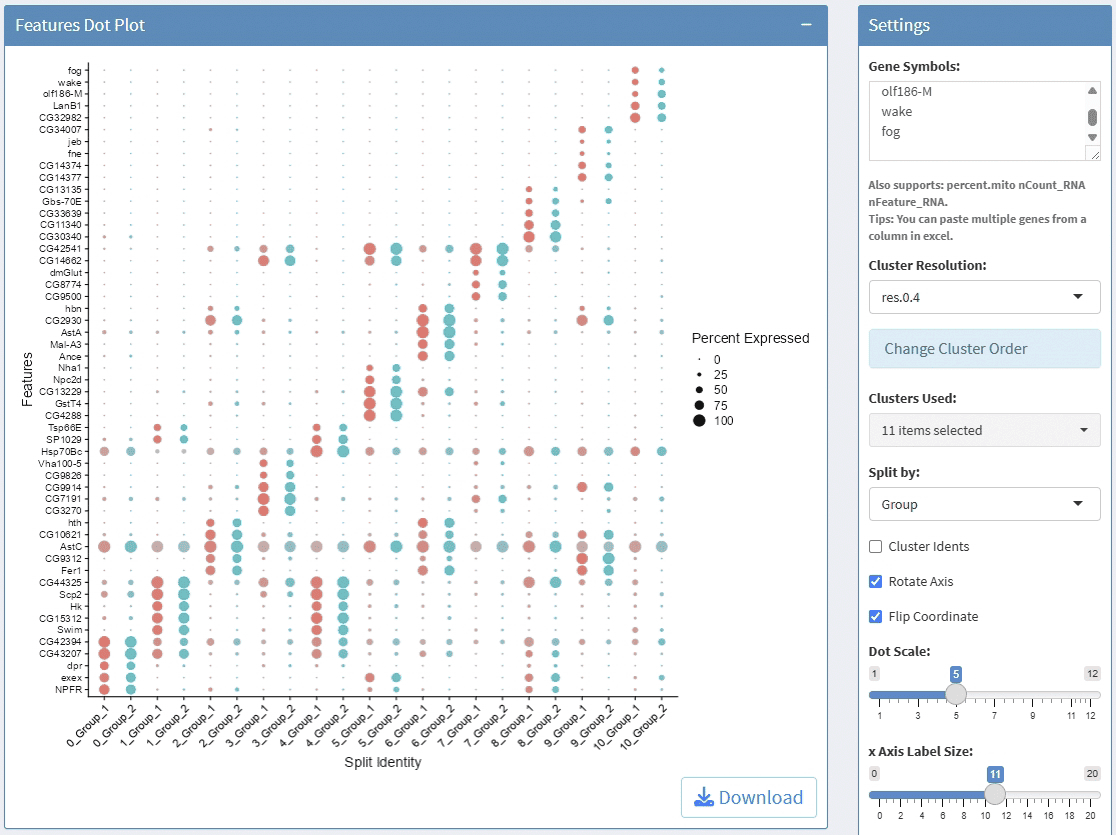
Example plots:
support display multiple genes simultaneous, genes names are case-insensitive. Tips: paste multiple genes from excel
support options for Cluster Resolution and reorder clusters
support adjust font size and rotation angle of cluster label
support adjust the font size of gene names
support adjust the height/width ratio of the plot
support download plot in pdf format, what you see is what you get
support switch Assays which contain any one of the slots: data, scale.data
Example plots:
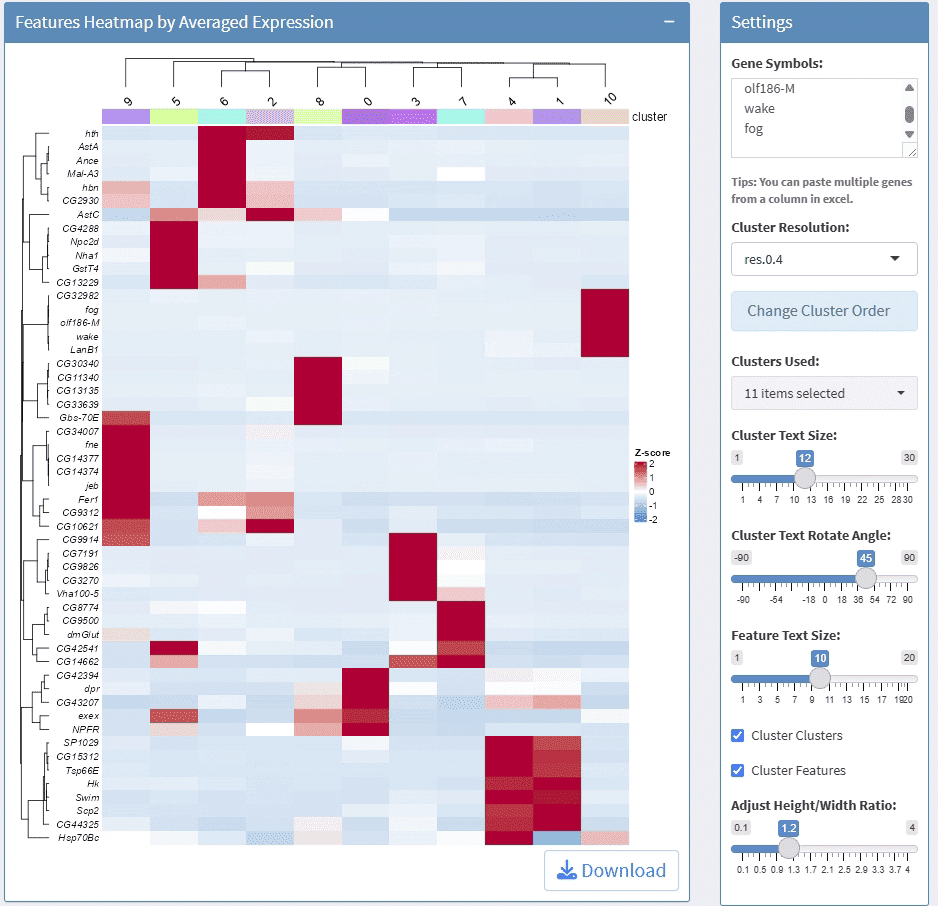
support display multiple genes simultaneous, genes names are case-insensitive. Tips: paste multiple genes from excel
support options for Cluster Resolution and reorder clusters
support adjust column numbers
support stack plot and color mapping
support adjust font size on x and y axis
support adjust the height/width ratio of the plot
support download plot in pdf format, what you see is what you get
support switch Assays which contain any one of the slots: counts, data, scale.data
Example plots:
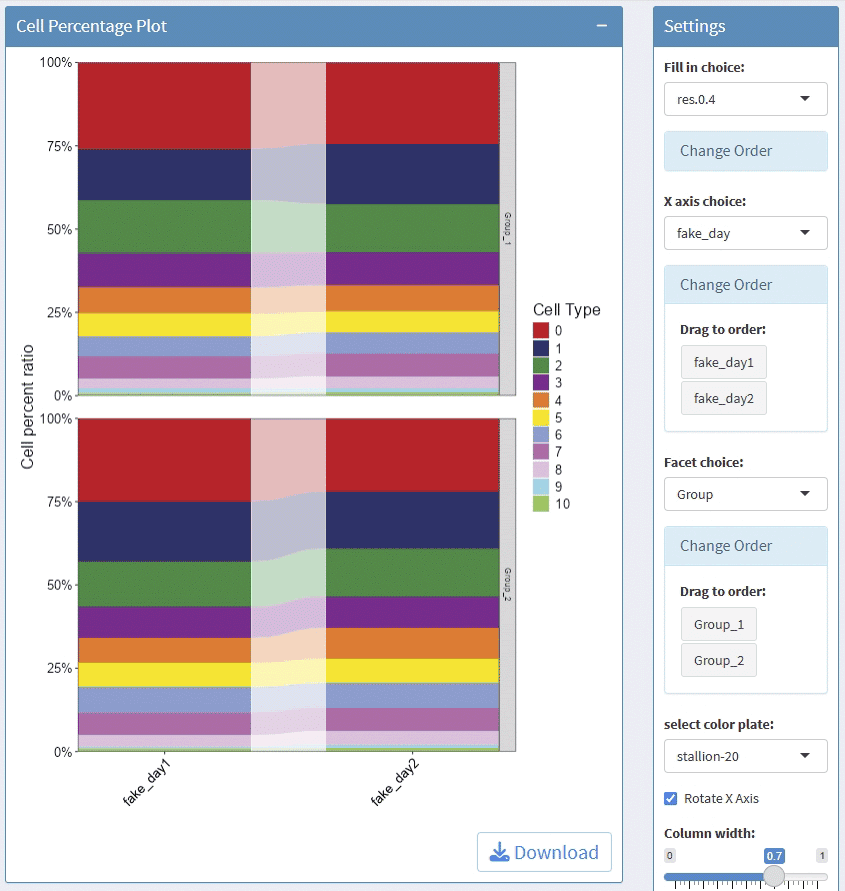
support facet
support adjust the height/width ratio of the plot
support download plot in pdf format, what you see is what you get
Example plots:
This usually takes longer, please wait patiently.Please save the
results before start a new analysis, the old results will be overwritten
by the new results, the results can be downloaded as csv
format.
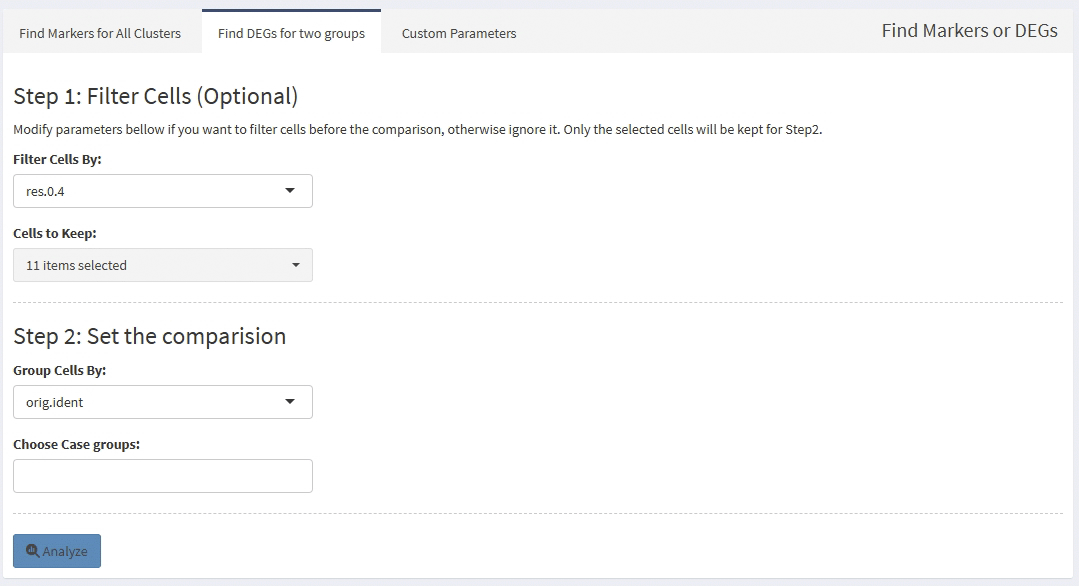
support find markers for all clusters
support calculate DEGs for self-defined two groups, you can subset cells before calculate DEGs between two groups, default use all cells of two groups.
You can modify part calculation parameters before a analysis.
Screen shots:
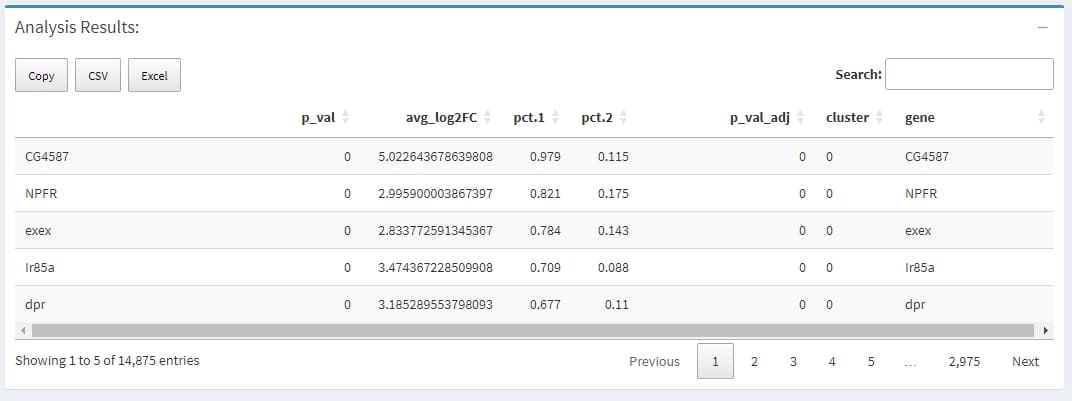
A data.frame with a ranked list of putative markers as rows, and associated statistics as columns (p-values, ROC score, etc., depending on the test used (test.use)). The following columns are always present:
avg_logFC: log fold-chage of the average expression between the two groups. Positive values indicate that the gene is more highly expressed in the first group
pct.1: The percentage of cells where the gene is detected in the first group
pct.2: The percentage of cells where the gene is detected in the second group
p_val_adj: Adjusted p-value, based on bonferroni correction using all genes in the dataset
Highly expressed genes can reflect the main functions of cells, there
two ways to do this. the first - Find Top Genes by Cell
could find gene only high express in a few cells, while the second -
Find Top Genes by Accumulated UMI counts is biased to find
the highly expressed genes in most cells by accumulated UMI counts.
Step1: for each cell, find genes that has high UMI percentage, for
example, if a cell has 10000 UMIs, and the
UMI percentage cutoff is set to 0.01, then all genes that
has more than 10000 * 0.01 = 100 UMIs is thought to be the highly
expressed genes for this cell.
Step2: summary those genes for each cluster, firstly get all highly expressed genes in a cluster, some genes may has less cells, then for each gene, count cells in which this genes is highly expressed, and also calculate the mean and median UMI percentage in those highly expressed cells.
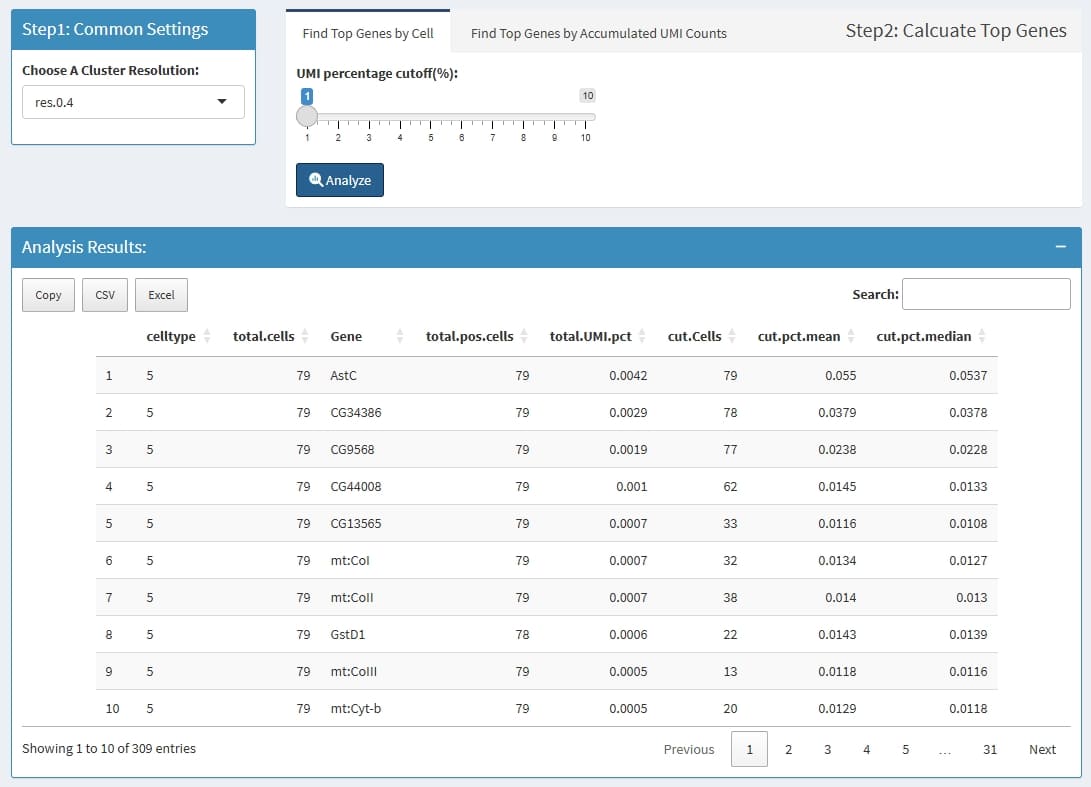
celltype: the cluster name which is define by
Choose A Cluster Resolution
total.cells: total cell in this cluster
Gene: this Gene is highly expressed in at least 1
cell in this cluster
total.pos.cells: how many cells express this
gene
total.UMI.pct: (all UMIs of this gene)/(total UMIs
of this cluster)
cut.Cells: how many cells highly express this
gene
cut.pct.mean: in those highly expressed cells, the
mean expression percentage
cut.pct.median: in those highly expressed cells, the
median expression percentage
for each cluster, calculate the top n highly expressed
genes by Mean UMI counts. if a cluster has less than 3 cells, this
cluster will be escaped.
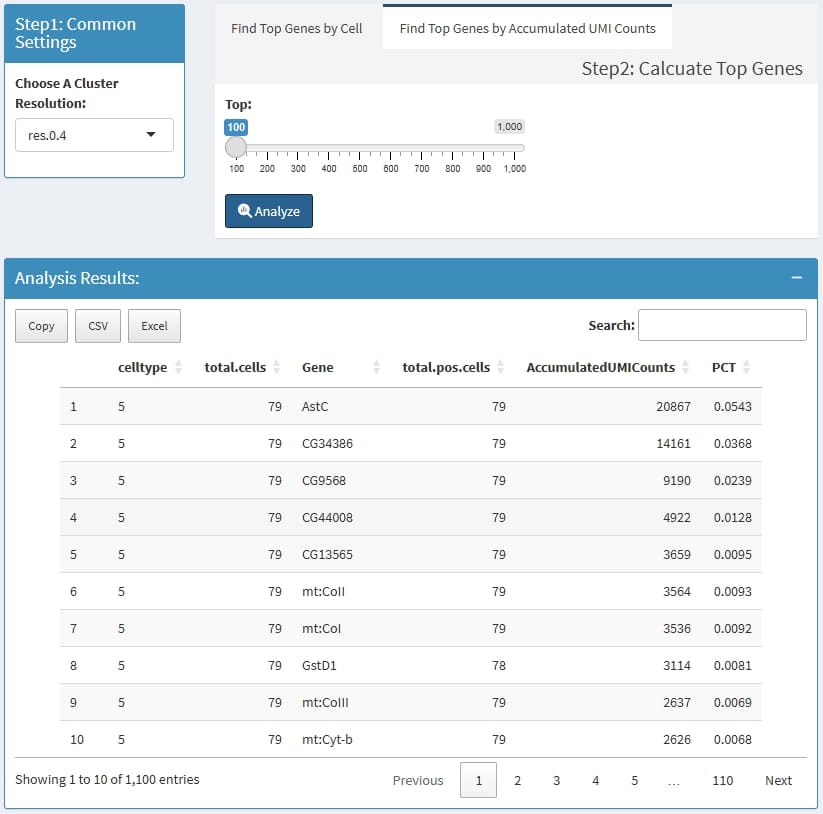
CellType: the cluster name which is define by
Choose A Cluster Resolution
total.cells: total cell in this cluster
Gene: the top n highly expressed
genes
total.pos.cells: how many cells express this
gene
MeanUMICounts: (total accumulated UMI counts) /
(total cells of this cluster)
PCT: (total accumulated UMI counts of the gene) /
(total UMIs of cluster cells)
Summary interested features by cluster, such as the positive cell percentage and mean/median expression level.
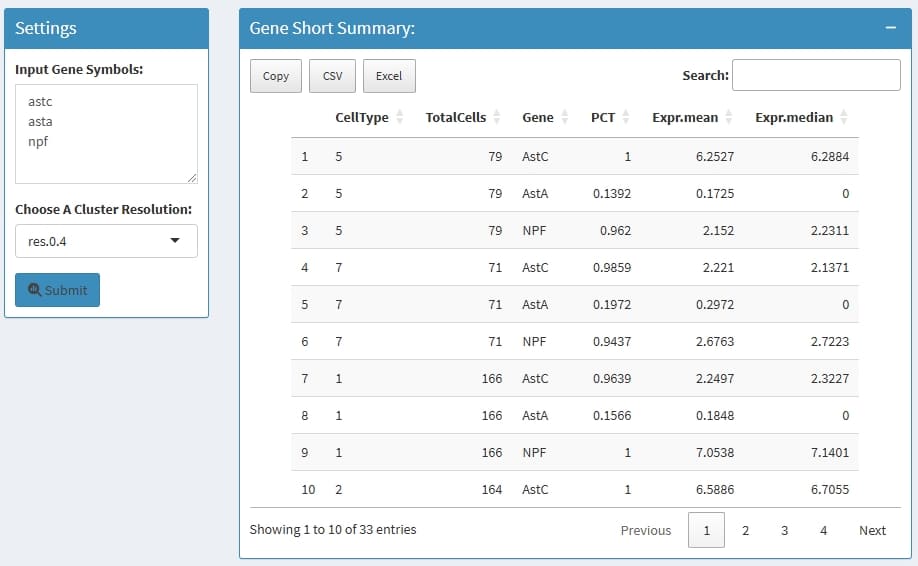
celltype: the cluster name which is define by
Choose A Cluster Resolution
TotalCells: total cell in this cluster
Gene: the input genes
PCT: the percentage of how many cells express this
gene in this cluster
Expr.mean: the mean normalized expression in this
cluster
Expr.median: the median normalized expression in
this cluster
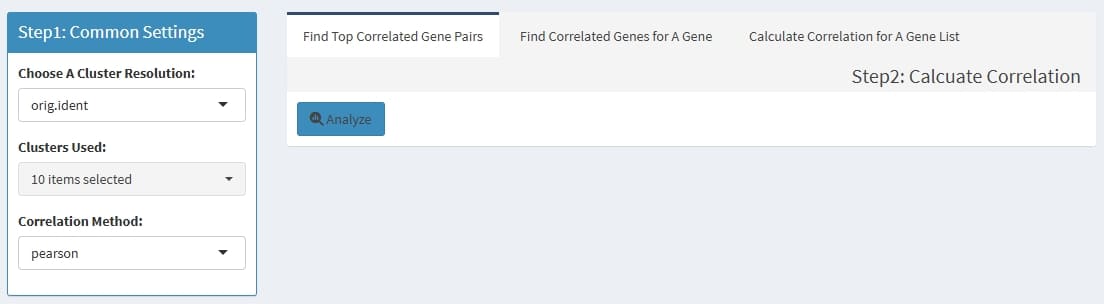
Can calculate the correlation value of gene pairs within cells from a cluster, support pearson & spearman methods.
Find Top Correlated Gene Pairs: to find top 1000
correlated gene pairs
Find Correlated Genes for A Gene: to find the most
correlated genes for input genes
Calculate Correlation for A Gene List: to calculate
the correlation value for each pair of the input genes
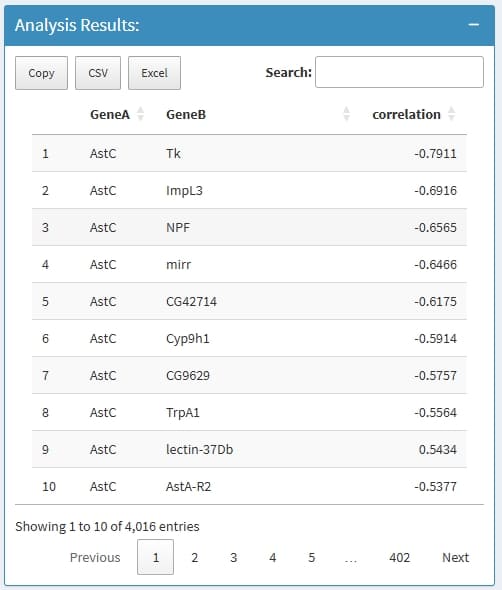
GeneA: the first gene in a Gene pair
GeneB: the second gene in a Gene pair
correlation: the correlation value
if nothing return, this is because the input genes has very low expression level, very low expressed genes will be removed before analysis.
You can rename cluster names, and changes will take effect immediately, while the raw Seurat object file will be never changed, once you close the session, the newly added annotation will be lost, You can download the old name and new name mapping file, and send it to technician to ask for permanent change.
all features(genes) extracted from the row names of assay, can be used search features.
The metadata of all cells extracted from the meta.data slot of Seurat object, which contains descriptive information for each cell, such as quality control metrics, cell type classifications, batch information, and experimental conditions. This metadata is crucial for organizing, filtering, integrating, and visualizing single-cell RNA-seq data.
csv format, which can
be used for further analysis.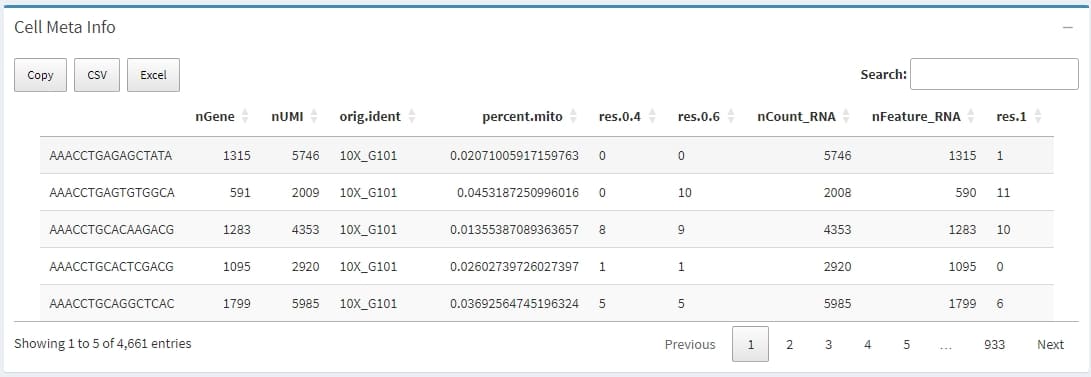
The Seurat object is an S4 class in R designed to store and manage single-cell expression data and associated analyses. It is a highly structured and self-contained object, allowing for the integration of various data modalities and analytical results.
Key Slots and their Contents:
assays: This is a list containing one or more Assay objects. Each Assay object represents a specific type of expression data. Each Assay object itself contains slots like counts (raw data), data (normalized data), scale.data (scaled data), and meta.features (feature-level metadata).
meta.data: A data frame storing cell-level metadata. This includes information such as the number of features detected per cell (nFeature_RNA), original identity classes (orig.ident), and can be extended with additional information (e.g., cell type annotations, sample information).
active.assay: A character string indicating the name of the currently active or default assay for analysis.
active.ident: Stores the active cluster identity for each cell, typically resulting from clustering analyses.
reductions: A list of DimReduc objects, each representing a dimensionality reduction technique applied to the data (e.g., PCA, UMAP, tSNE). These objects store the lower-dimensional embeddings of the cells.
graphs: A list of Graph objects, typically storing nearest-neighbor graphs used in clustering and other analyses. images: For spatial transcriptomics data, this slot stores Image objects containing spatial image data and information linking spots to their physical locations.
project.name: A character string holding the name of the project.
misc: A list for storing miscellaneous information not fitting into other specific slots.
Yeah, it’s the tutorial right here!
For the best experience with SeuratExplorer, ensure your Seurat object contains:
RNA, ATAC,
etc.)umap, tsne, or
pca)meta.data slot) with cluster
informationseurat_clusters at
different resolutions).rds: Standard R data format (smaller files, faster
I/O).qs2: QSZ compression format (better compression for
large objects)MaxInputFileSize parameter).qs2 format for better compression of large
objects# Basic Seurat preprocessing
library(Seurat)
# Load your data
seurat_obj <- Read10X(data.dir = "path/to/data")
seurat_obj <- CreateSeuratObject(counts = seurat_obj)
# Standard processing
seurat_obj <- NormalizeData(seurat_obj)
seurat_obj <- FindVariableFeatures(seurat_obj)
seurat_obj <- ScaleData(seurat_obj)
seurat_obj <- RunPCA(seurat_obj)
seurat_obj <- RunUMAP(seurat_obj, dims = 1:30)
# Clustering at multiple resolutions
seurat_obj <- FindNeighbors(seurat_obj, dims = 1:30)
seurat_obj <- FindClusters(seurat_obj, resolution = 0.4)
seurat_obj <- FindClusters(seurat_obj, resolution = 0.8)
# Save for SeuratExplorer
saveRDS(seurat_obj, "my_seurat_object.rds")
# or
qs2::qs_save(seurat_obj, "my_seurat_object.qs2")Q: Can I use SeuratExplorer with Seurat v3 objects?
A: Yes! SeuratExplorer automatically updates old Seurat objects when
loading. However, for very old versions (v2 or earlier), manual update
using UpdateSeuratObject() may be required before use.
Q: Is my data uploaded to any server?
A: No. When running locally (launchSeuratExplorer()),
all data stays on your computer. Only when deployed on a Shiny Server
would data be uploaded to that server.
Q: Can I save my analysis results?
A: Yes! Most visualizations can be downloaded as PDF files. Analysis results (DEGs, feature summaries, etc.) can be downloaded as CSV files. Cluster name mappings can also be exported.
Q: What’s the difference between the two “Top Expressed Features” methods?
A: - Find Top Genes by Cell: Identifies genes that are highly expressed in individual cells, useful for finding cell-specific markers - Find Top Genes by Mean UMI: Finds genes with high average expression across all cells in a cluster, useful for identifying cluster characteristics
Q: How do I add custom color palettes?
A: While SeuratExplorer includes many predefined color palettes, you
can use the getColors() function in your own R scripts to
access these palettes for custom visualizations.
satijalab/seurat: Seurat is an R toolkit for single cell genomics, developed and maintained by the Satija Lab at NYGC. SeuratExplorer builds upon Seurat’s powerful analysis capabilities to provide interactive visualization.
rstudio/shiny: Shiny is an R package that makes it easy to build interactive web apps straight from R. SeuratExplorer uses Shiny to create its interactive dashboard.
ggplot2: A system for declaratively creating graphics, based on “The Grammar of Graphics”. SeuratExplorer uses ggplot2 for all its visualizations.
ComplexHeatmap: Bioconductor package for making complex heatmaps with annotations.
shinydashboard: Create dashboards with Shiny. SeuratExplorer uses this for its admin-style interface.
Hla-Lab/SeuratExplorer: An interactive R shiny application for exploring scRNAseq data processed in Seurat (another implementation with similar goals).
junjunlab/scRNAtoolVis: Some useful functions to make your scRNA-seq plots more beautiful. Some code from this package has been adapted in SeuratExplorer.
rstudio/shiny-server: Shiny Server is a server program that makes Shiny applications available over the web. Use this to deploy SeuratExplorer on a server for multi-user access.
?function_name in RSeuratExplorer is built upon excellent work by:
#> R version 4.4.3 (2025-02-28 ucrt)
#> Platform: x86_64-w64-mingw32/x64
#> Running under: Windows 11 x64 (build 26200)
#>
#> Matrix products: default
#>
#>
#> locale:
#> [1] LC_COLLATE=Chinese (Simplified)_China.utf8
#> [2] LC_CTYPE=Chinese (Simplified)_China.utf8
#> [3] LC_MONETARY=Chinese (Simplified)_China.utf8
#> [4] LC_NUMERIC=C
#> [5] LC_TIME=Chinese (Simplified)_China.utf8
#>
#> time zone: Asia/Shanghai
#> tzcode source: internal
#>
#> attached base packages:
#> [1] stats     graphics  grDevices utils     datasets  methods   base
#>
#> loaded via a namespace (and not attached):
#>  [1] compiler_4.4.3    fastmap_1.2.0     cli_3.6.5         tools_4.4.3
#>  [5] htmltools_0.5.9   otel_0.2.0        rstudioapi_0.17.1 yaml_2.3.12
#>  [9] rmarkdown_2.30    knitr_1.51        xfun_0.55         digest_0.6.39
#> [13] rlang_1.1.6       evaluate_1.0.5