![]()
{RSSthemes} is an R package for styling graphics for RSS publications. This package accompanies the Best Practices for Data Visualisation guidance, published by the Royal Statistical Society, which can be found at royal-statistical-society.github.io/datavisguide.
This package, the data visualisation guidance site and its content are under development, and the authors welcome feedback and contributions.
A brief overview of the package is given below. For a more in-depth discussion of this R package please see royal-statistical-society.github.io/datavisguide/docs/tools.html for the most up-to-date information.
You can install the package from CRAN using:
install.packages("RSSthemes")You can install the development version from GitHub with:
remotes::install_github("nrennie/RSSthemes")You can then load the package using:
library(RSSthemes)There are currently three palettes available in {RSSthemes}, although we hope to add more in the future.
Let’s set up a basic data set.
library(ggplot2)
plot_df <- data.frame(x = LETTERS[1:4],
                      y = 1:4)
Single colour charts
If all of the bars, lines, points, etc. should have the same colour,
you can set either the fill or colour
arguments to have one of the RSS colours. The options are:
signif_red, signif_blue,
signif_green, signif_orange, or
signif_yellow.
ggplot(data = plot_df,
       mapping = aes(x = x, y = y)) +
  geom_col(fill = signif_yellow)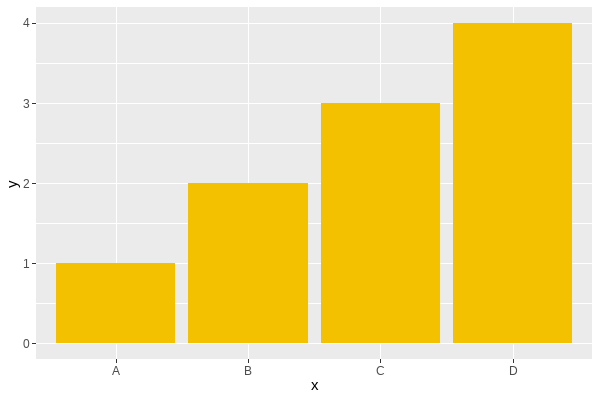
Qualitative palettes
For working with qualitative (discrete) data, the best palette to use
is "signif_qual". This palette currently only contains four
colours.
Discrete (fill) scale: scale_fill_rss_d()
ggplot(data = plot_df,
       mapping = aes(x = x, y = y, fill = x)) +
  geom_col() +
  scale_fill_rss_d(palette = "signif_qual")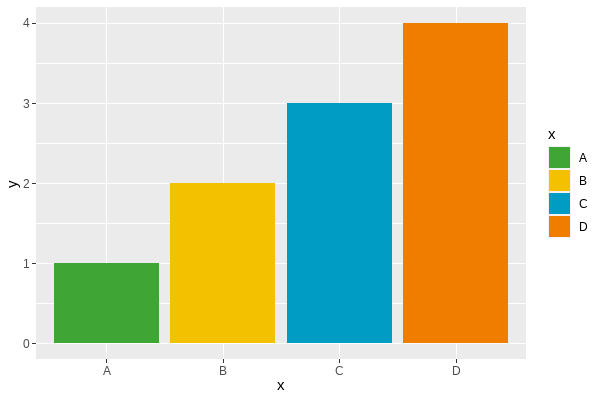
Discrete (colour) scale: scale_colour_rss_d()
ggplot(data = plot_df,
       mapping = aes(x = x, y = y, colour = x)) +
  geom_point(size = 4) +
  scale_colour_rss_d(palette = "signif_qual")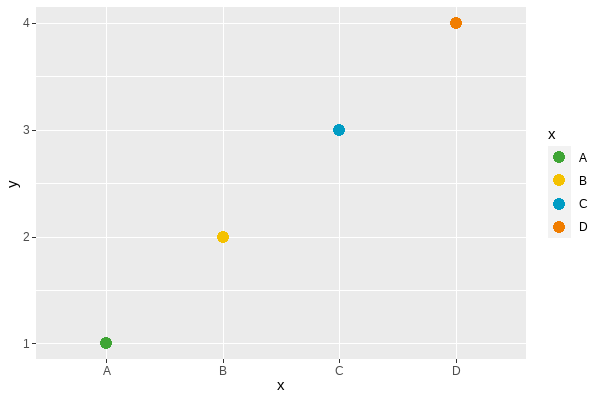
Sequential palettes
For working with sequential (continuous) data, the best palette to
use is "signif_seq".
Continuous (fill) scale: scale_fill_rss_c()
ggplot(data = plot_df,
       mapping = aes(x = x, y = y, fill = y)) +
  geom_col() +
  scale_fill_rss_c(palette = "signif_seq")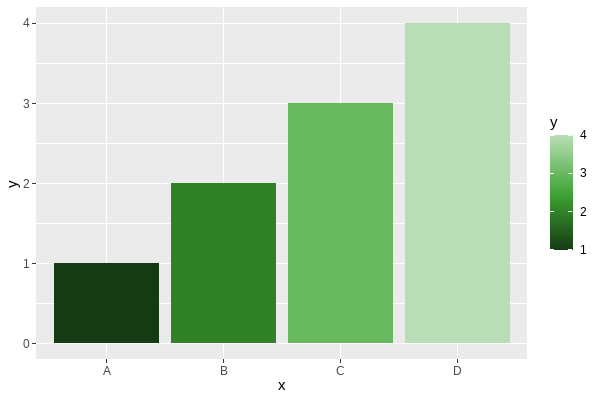
Continuous (colour) scale: scale_colour_rss_c()
ggplot(data = plot_df,
       mapping = aes(x = x, y = y, colour = y)) +
  geom_point(size = 4) +
  scale_colour_rss_c(palette = "signif_seq")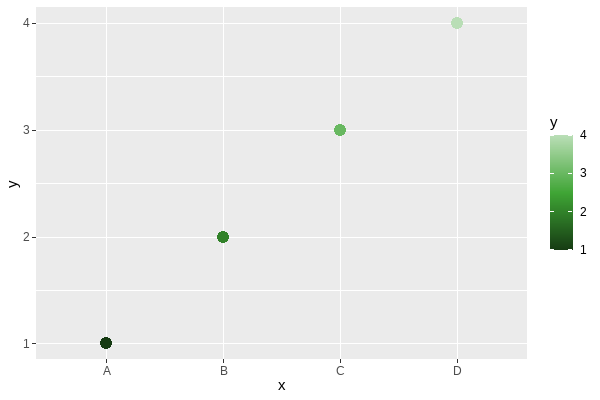
Diverging palettes
For working with diverging (continuous) data, the best palette to use
is "signif_div".
Continuous (fill) scale: scale_fill_rss_c()
ggplot(data = plot_df,
       mapping = aes(x = x, y = y, fill = y)) +
  geom_col() +
  scale_fill_rss_c(palette = "signif_div")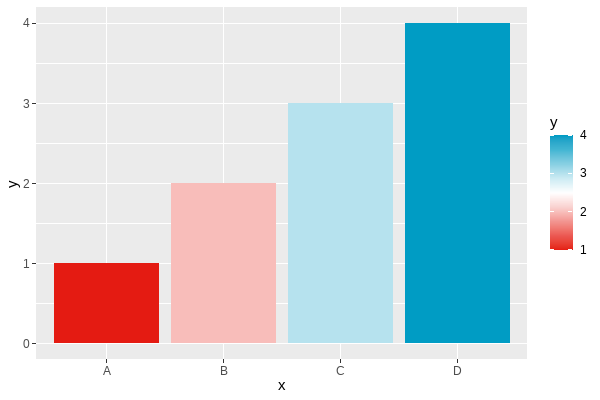
If you want to centre the diverging scale around a different value,
you can alternatively pass the pre-defined colours into
scale_fill_gradient2() from {ggplot2}:
ggplot(data = plot_df,
       mapping = aes(x = x, y = y, fill = y)) +
  geom_col() +
  scale_fill_gradient2(low = signif_red, high = signif_blue, midpoint = 2)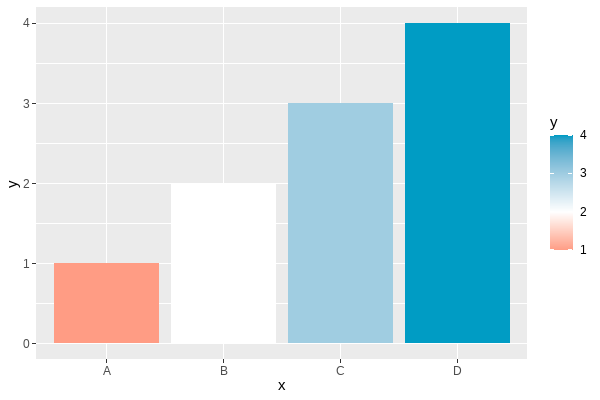
If all of the bars, lines, points, etc. should have the same colour,
you can set col arguments to have one of the RSS colours.
The options are: signif_red, signif_blue,
signif_green, signif_orange, or
signif_yellow.
barplot(table(mtcars$gear), col = signif_blue)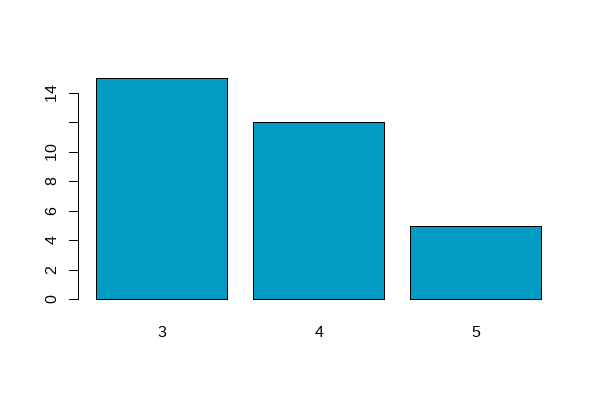
You can use the set_rss_palette() function to change the
default colours used in base R plotting:
set_rss_palette("signif_qual")
plot(1:4, 1:4, col=1:4, pch=19, cex=3, xlab="", ylab="")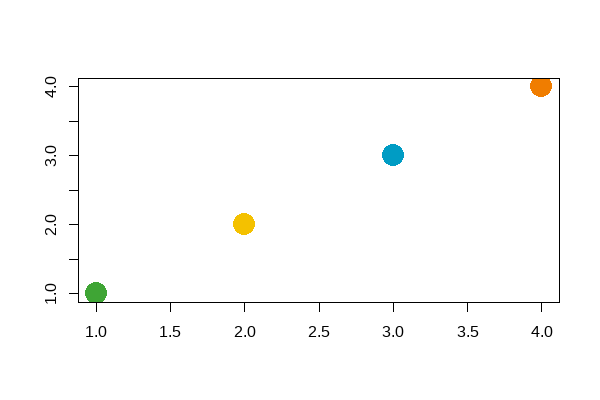
Run palette("default") to reset to original base R
colours.
Theme functions style the non-data elements of plots, e.g. fonts, text colour, or background colour.
Apply styling to plots made with {ggplot2} using the
theme_significance() function:
ggplot(data = plot_df,
       mapping = aes(x = x, y = y, fill = x)) +
  geom_col() +
  labs(title = "My Significance Plot",
       subtitle = "Some longer sentence explaining what is happening in the chart.",
       caption = "Source: name of data source") +
  scale_fill_rss_d(palette = "signif_qual") +
  theme_significance()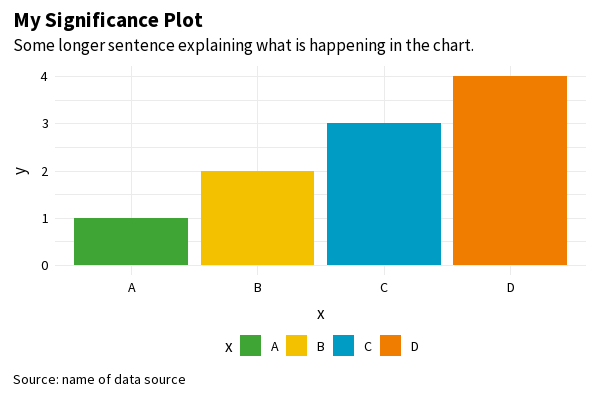
Apply styling to plots made with base R using the
set_signif_par() function. We also recommend adding
reference lines using the abline() function:
set_signif_par()
plot(1:4, 1:4, col=1:4, pch=19, cex=3, xlab="", ylab="",
     main = "My Significance Plot",
     sub = "Source: data source")
abline(h=1:4, v=1:4, col = "lightgrey")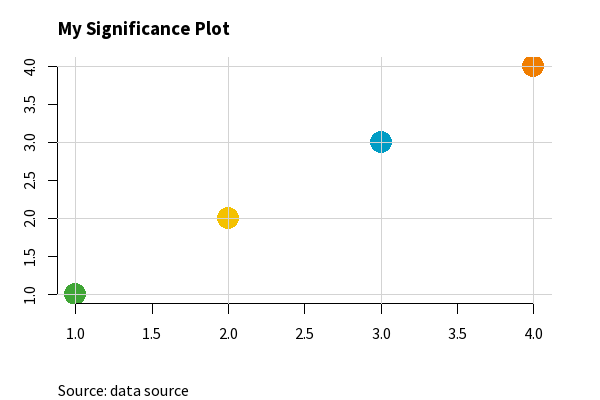
Please open up a discussion in the repository’s Discussions section.
Please either:
main branch of this repository.my-new-feature-or-section.main branch of this
repository.Proposals for new features will be reviewed by the lead author team (“lead authors”):
Andreas Krause
Nicola Rennie
Brian Tarran
Lead authors may offer feedback or suggestions to contributors before agreeing to merge pull requests. Lead authors reserve the right to refuse to merge pull requests, and the decision of the lead authors is final.
Use of, and all contributions to, our website and repository are governed by our Code of Conduct.
This package is licensed under a Creative Commons Attribution 4.0 (CC BY 4.0) International licence, meaning it can be used and adapted for any purpose, provided attribution is given to the original authors. By contributing to this guide, contributors agree to licence their work under the same terms.
This package stores and loads Source Sans Pro fonts for use in the theme functions. Source Sans Pro font was developed by Paul D. Hunt, and more information can be found at fonts.adobe.com/fonts/source-sans. These fonts have the following copyright: Copyright 2010, 2012, 2014 Adobe Systems Incorporated https://www.adobe.com/, with Reserved Font Name ‘Source’. The fonts are licensed under the SIL Open Font License, Version 1.1. See: http://scripts.sil.org/OFL.