The RImagePalette package is a pure R implementation of
the median cut algorithm for extracting the dominant colors from an
image. This package lets you use the colors from an image you like to
create pretty plots, or to swap colors from one image to another.
Install from CRAN using:
install.packages("RImagePalette")Or from github, using:
devtools::install_github("joelcarlson/RImagePalette")It’s simple to create palettes from an image using the
image_palette() function:
library(RImagePalette)

#Load an image
lifeAquatic <- jpeg::readJPEG("figs/LifeAquatic.jpg")
display_image(lifeAquatic)
#Create a palette of 9 colors
lifeAquaticPalette <- image_palette(lifeAquatic, n=9)
scales::show_col(lifeAquaticPalette)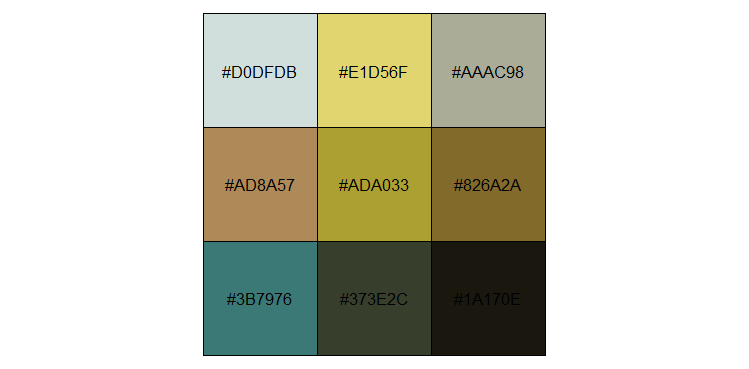
Not happy with the results? We can tweak some settings until the scale is to our liking:
lifeAquaticPalette <- image_palette(lifeAquatic, n=9, choice=median, volume=TRUE)
scales::show_col(lifeAquaticPalette)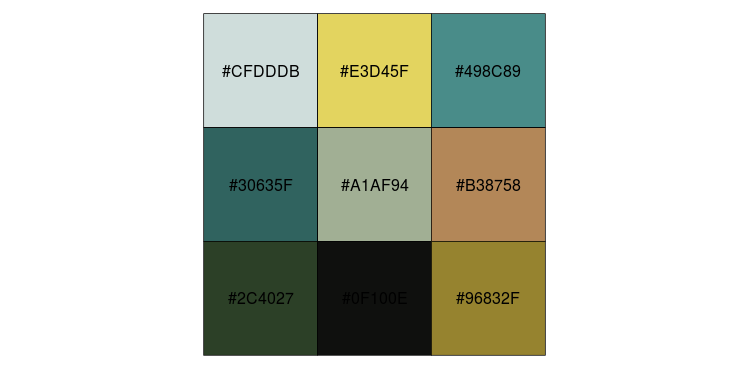
If it contains colors we like, we can pick and choose, and use them as a scale:
library(ggplot2)
#Create plot
p <- ggplot(data = iris, aes(x=Species, y=Sepal.Width, fill=Species)) + geom_bar(stat="identity")
#Apply scale
p + theme_bw() + scale_fill_manual(values=lifeAquaticPalette[c(2,3,6)])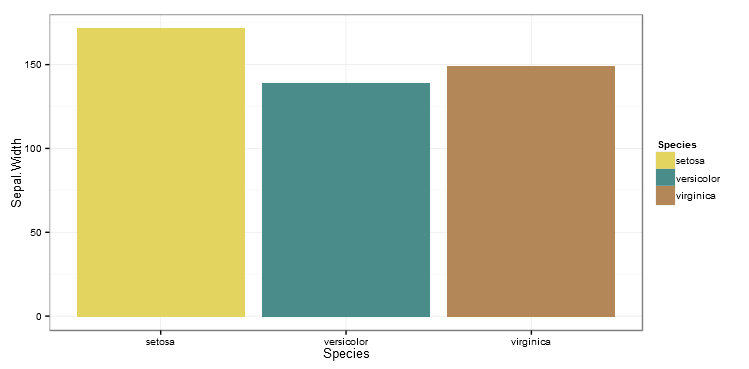
RImagePalette can create both discrete and continuous
scales from images for use with ggplot2 using the new
scale_color_image (or for plots requiring fills, the
scale_fill_image()) function:
#Load an image
desert <- jpeg::readJPEG("figs/Desert.jpg")
display_image(desert)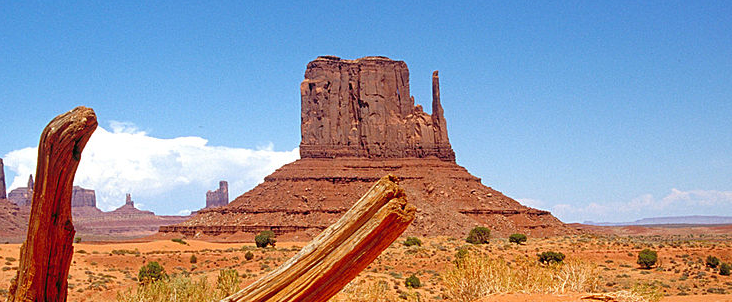
#Create plot
p <- ggplot(data = iris, aes(x=Sepal.Length, y=Sepal.Width, col=Species)) + geom_point(size=3)
#Add discrete scale from image
p + theme_bw() + scale_color_image(image=desert)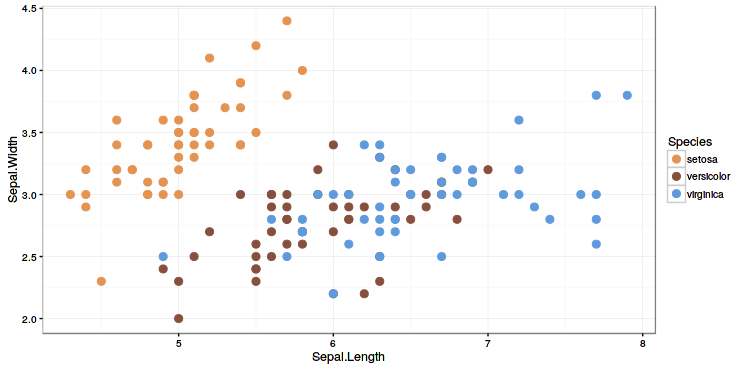
#Create plot
p <- ggplot(data = iris, aes(x=Sepal.Length, y=Sepal.Width, col=Sepal.Length)) + geom_point(size=3)
#Use discrete=FALSE for a continuous scale
p + theme_bw() + scale_color_image(image=desert, discrete=FALSE) 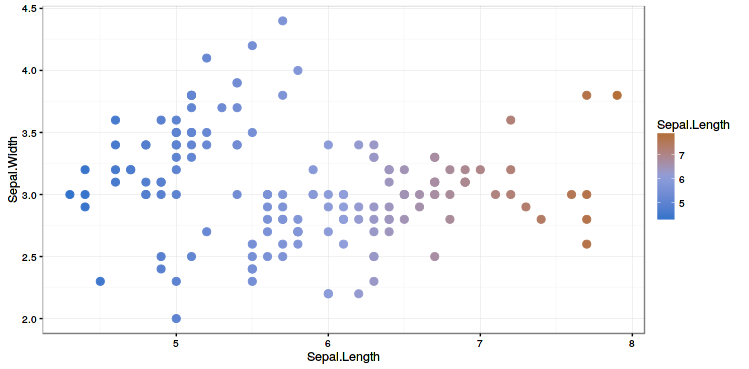
Note: This feature is experimental at the moment, and as such is
non-optimized, and slow. You must install from github to access the
quantize_image function
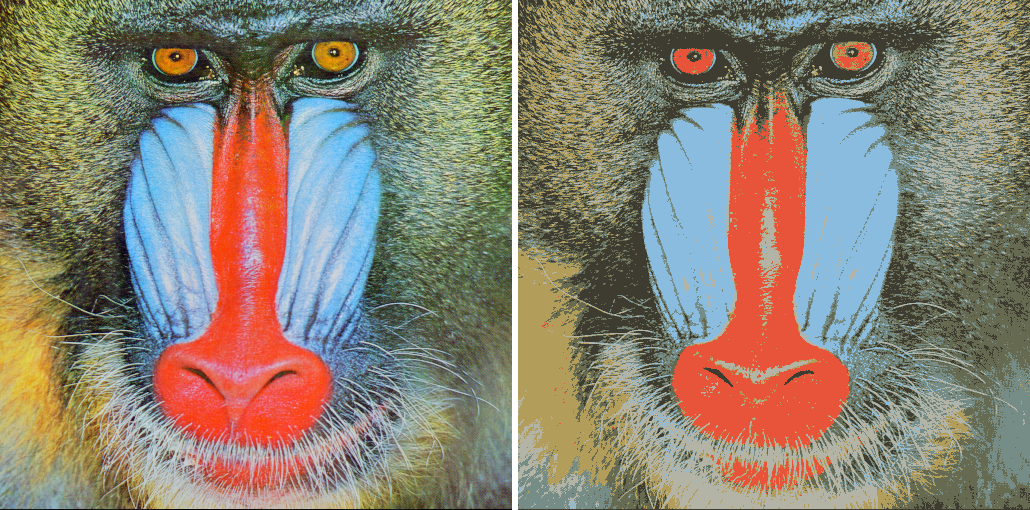
We can also quantize images into a discrete number of colors using
the quantize_image function:
#Load the famous mandrill
mandrill <- png::readPNG("figs/mandrill.png")

#Quantize using 7 colors
quant_mandrill <- quantize_image(mandrill, n=7)
When displayed closely reproduces the original image:
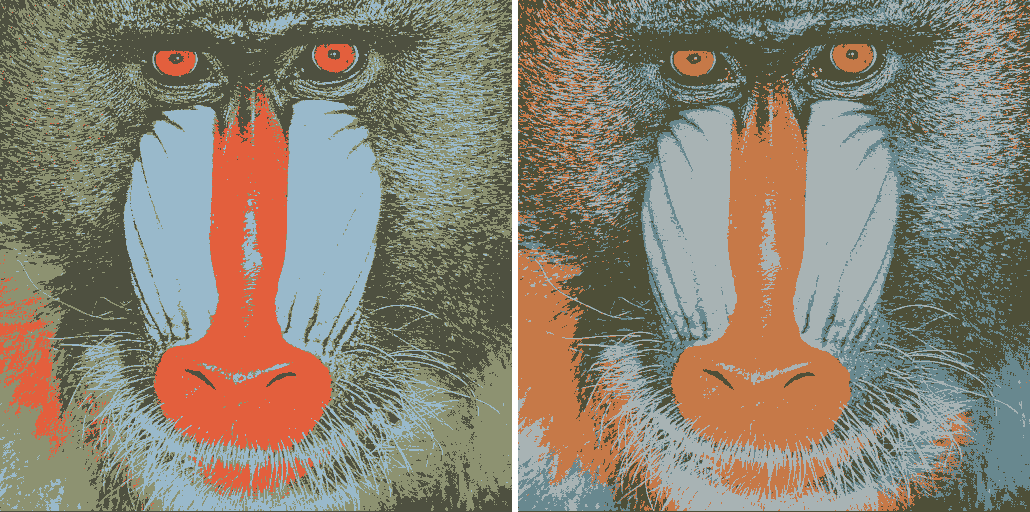
Another method for doing so is to use the kmeans approach, as discussed in this blog post by Ryan Walker. Here is the comparison between kmeans (on the left) and median cut (on the right) using 4 colors:
We can swap colors across images using the
switch_colors() function:
celery <- jpeg::readJPEG("figs/CeleryLunch.jpg")
billMurray <- jpeg::readJPEG("figs/BillMurray.jpg")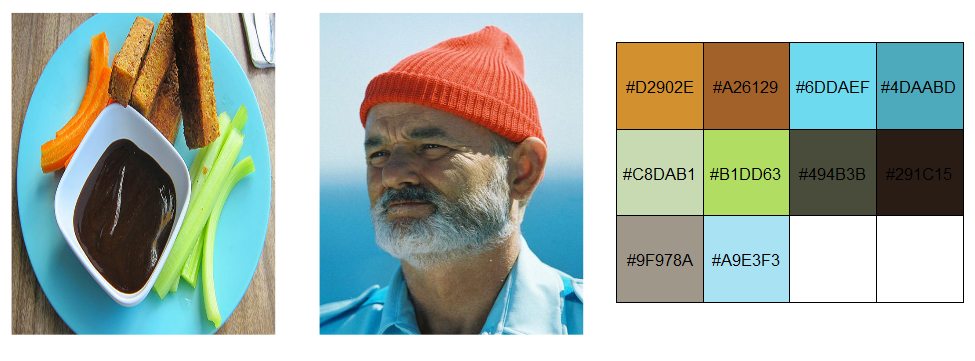
switch_colors(billMurray, celery, source_colors = 10)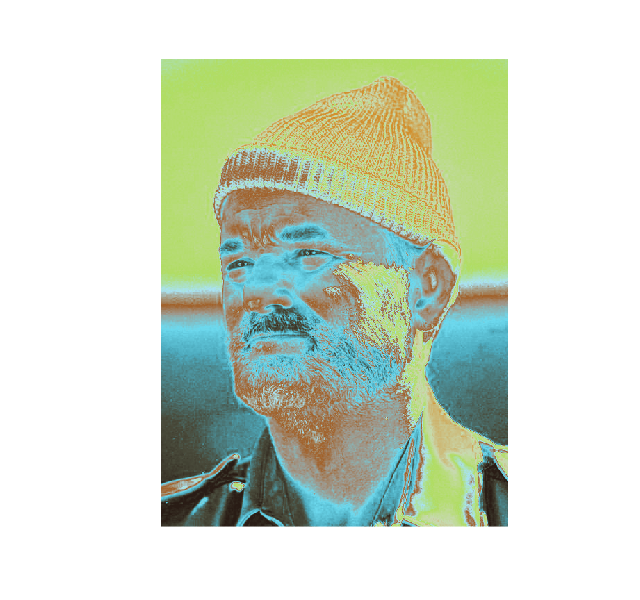
There is an element of randomness in the median cut algorithm, so set
your seeds carefully, and try running the algorithm a few times if you
aren’t happy with the results. Other ways to alter the palette: try
using choice = median, volume = TRUE or change
the value of n.
There are a number of projects that inspired or helped this project along, and they deserve some recognition:
color-thief.js by Lokesh Dhakar.
Wes Anderson Palettes by Karthik Ram.
this blog post from Jo Fai Chow.
and this blog post by Ryan Walker
Thank you all for your great work!