Package Version History
3.12 HVT (v26.1.3) - What’s New
29th April, 2026
In this version of the HVT package, several bug fixes and
improvements have been made to enhance stability and performance.
Bug Fixes:
- Fixed a crash in
msm where comparisons against
n_nearest_neighbor were performed without a null check,
causing failures when the parameter was not supplied
- Fixed missing initialization of intermediate variables before
conditional blocks in
msm, which caused undefined variable
errors on early exit paths
- Fixed
scoreHVT not returning centroidData
in its output, causing downstream null-access failures in
msm and clustHVT
- Fixed
clustHVT crashing when centroidData
was absent from scoring results; it now falls back to reconstructing
centroid coordinates from cellID_coordinates
Improvements:
- Extracted repeated polygon centroid, cell coordinate extraction,
boundary coordinate construction, and cell label alignment logic into a
shared
utilities.R file, reducing duplication across
plotHVT, scoreHVT, and
scoreLayeredHVT.
- Moved the hardcoded colour palette from
plotHVT and
clusterPlot into constants.R as a named
constant.
3.11 HVT (v26.1.2)
5th February, 2026
In this version of the HVT package, a minor issue related to the
global initialization of a variable has been fixed.
3.10 HVT (v26.1.1)
22nd January, 2026
In this version of the HVT package, the following enhancement and
feature has been made:
Enhancement
- LLM Embeddings Vignette: This vignette showcases
the HVT workflow applied to numerical embedding data generated using an
OpenAI model, featuring a more robust preprocessing pipeline and a
revamped implementation aligned with recent AI developments.
Feature
- 2D HVT Plots: In this version, the aesthetics of
compressed 2D HVT plots have been enhanced by adding new arguments to
the
plotHVT and scoreHVT functions. These
updates allow users to toggle the display of cell centroids, adjust
their sizes, and position cell IDs at the center, enabling clearer
visualization of dense heatmaps with more legible centroids and cell
labels.
3.9 HVT (v25.2.8)
16th December, 2025
In this version of the HVT package, the following new feature has
been introduced:
- Ex-ante raw series forecasting: A new feature
enabling ex-ante raw series forecasting directly from transformed
year-over-year (YoY) forecasts using a 12-month lookback approach. This
allows the percentage changes from ex-ante transformed forecasts to be
translated back into the raw series for each variable. This feature is
introduced and explained in ‘Dynamic Forecasting of Macroeconomic Time
Series Dataset using HVT’ vignette.
3.8 HVT (v25.2.7)
22nd October, 2025
In this version of the HVT package, the following new feature and
vignette have been introduced:
Feature
Experimentation of hyperparameters in
msm: This update introduces a new function called
HVTMSMoptimization that runs grid search experiments across
different hyperparameters (number of cells, clusters(k), nearest
neighbors(nn)) by training and scoring HVT models, running MSM
simulations for each combination and identify the champion model (lowest
MAE across all results).
Tabulation and Visualization: Accessory
functions to HVTMSMoptimization such as
OptimizationResults and plotMsmKN has been
added which helps to tabulate all the iterations and visualize the
output via plotly object.
Vignette
- Hyperparameter Experimentation for Champion Model Selection
in MSM Dynamic Forecasting: This vignette provides a
comprehensive demonstration of using
HVTMSMoptimization,
covering the complete workflow from initial dataset handling, selection
for train & test, executing hyperparameter tuning and identifying
the champion model, implementing the champion model, and comparing MAE
results.
3.7 HVT (v25.2.6)
14th October, 2025
The issue with time-series animation plots from previous release
has now been resolved with the latest gganimate update.
3.6 HVT (v25.2.5)
04th July, 2025
Dropping the time-series animation plots from the package since
the latest version of gganimate doesn’t support them — a patched release
will follow once the issue is resolved.
3.5 HVT (v25.2.4)
04th June, 2025
In this version of the HVT package, the following new features and
vignette have been introduced:
Features
Dynamic Forecasting of a Time Series Dataset:
This update introduces a new function called msm Monte
Carlo Simulations of Markov Chain for dynamic forecasting of states in
time series dataset. It supports both ex-post and ex-ante forecasting,
offering valuable insights into future trends while resolving state
transition challenges through clustering and nearest-neighbor methods to
enhance simulation accuracy.
Z score Plots: This update introduces a new
function called plotZscore that generates Z-score plots
corresponding to the HVT cells for the given data, offering a visual
representation of data distribution and highlighting potential
outliers.
Vignette
- Dynamic Forecasting of Macroeconomic Time Series Dataset
using HVT: This vignette illustrates the practical use of the
new msm function on a macroeconomic dataset with 10 variables. It covers
all steps, including data preparation, model training, scoring, and
forecasting, while addressing challenges related to state transitions
and evaluating performance using Mean Absolute Error (MAE).
3.4 HVT (v24.9.1)
4th September, 2024
In this version of the HVT package, the following new features and
vignettes have been introduced:
Features
Implementation of t-SNE and UMAP in
trainHVT: This update incorporates dimensionality
reduction methods like t-SNE and UMAP in the trainHVT
function, complementing the existing Sammon’s projection. It also
enables the visualization of these techniques across all hierarchical
levels within the HVT framework.
Implementation of dimensionality reduction evaluation
metrics: This update introduces highly effective dimensionality
reduction evaluation metrics as part of the output list of the
trainHVT function. These metrics are organized into two
levels: Level 1 (L1) and Level 2 (L2). The L1 metrics address key areas
of dimensionality reduction which are mentioned below, by ensuring
comprehensive evaluation and performance.
- Structure Preservation Metrics
- Distance Preservation Metrics
- Human Centered Metrics
- Interpretive Quality Metrics
- Computational Efficiency Metrics
- Introduction of
clustHVT function: In
this update, we introduced a new function called clustHVT
specifically designed for Hierarchical clustering analysis. The function
performs clustering of cells exclusively when the hierarchy level is set
to 1, determining the optimal number of clusters by evaluating various
indices. Based on user input, it conducts hierarchical clustering using
AGNES with the default ward.D2 method. The output includes a dendrogram
and an interactive 2D clustered HVT map that reveals cell context upon
hovering. This function is not applicable when the hierarchy level is
greater than 1.
Vignettes
Implementation of t-SNE and UMAP in trainHVT
function: This vignette showcases the integration of t-SNE and
UMAP in the trainHVT function, offering a comprehensive
guide on how to apply and visualize these dimensionality reduction
techniques. It also covers the dimensionality reduction evaluation
metrics and provides insights into their interpretation.
Visualizing LLM Embeddings using HVT (Hierarchical
Voronoi Tessellation): This vignette will outline the process
of analyzing OpenAI-generated token embeddings using the HVT package,
covering data compression, visualization, and hierarchical clustering,
as well as comparing domain name assignments for clusters. It examines
HVT’s effectiveness in preserving contextual relationships between
embeddings. Additionally, it provides a brief overview of the newly
added clustHVT function and its parameters.
3.3 HVT (v24.5.2)
2nd May, 2024
In this version of HVT package, the following new features have been
introduced:
- Updated Nomenclature: To make the function names
more consistent and understandable/intuitive, we have renamed the
functions throughout the package. Given below are the few
instances.
HVT to trainHVTpredictHVT to scoreHVTpredictLayerHVT to scoreLayeredHVT
- Restructured Functions: The functions have been
rearranged and grouped into new sections which are highlighted on the
index page of package’s PDF documentation. Given below are the few
instances.
trainHVT function now resides within the
Training_or_Compression section.plotHVT function now resides within the
Tessellation_and_Heatmap section.scoreHVT function now resides within the
Scoring section.
Enhancements: The pre-existed functions,
hvtHmap and exploded_hmap, have been combined
and incorporated into the plotHVT function. Additionally,
plotHVT now includes the ability to perform 1D
plotting.
Temporal Analysis
- The new update focuses on the integration of time series
capabilities into the HVT package by extending its foundational
operations to time series data which is emphasized in this
vignette.
- The new functionalities are introduced to analyze underlying
patterns and trends within the data, providing insights into its
evolution over time and also offering the capability to analyze the
movement of the data by calculating its transitioning probability and
creates elegant plots and GIFs.
Below are the new functions and its brief descriptions:
plotStateTransition: Provides the time series flowmap
plot.getTransitionProbability: Provides a list of transition
probabilities.reconcileTransitionProbability: Provides plots and
tables for comparing transition probabilities calculated manually and
from markovchain function.plotAnimatedFlowmap: Creates flowmaps and animations
for both self state and without self state scenarios.
3.2 HVT (v23.11.02)
17th November, 2023
This version of HVT package offers functionality to score cells with
layers based on a sequence of maps created using
scoreLayeredHVT. Given below are the steps to created the
successive set of maps.
Map A - The output of trainHVT
function which is trained on parent data.
Map B - The output of trainHVT
function which is trained on the ‘data with novelty’ created from
removeNovelty function.
Map C - The output of trainHVT
function which is trained on the ‘data without novelty’ created from
removeNovelty function.
The scoreLayeredHVT function uses these three maps to
score the test datapoints.
Let us try to understand the steps with the help of the diagram
below
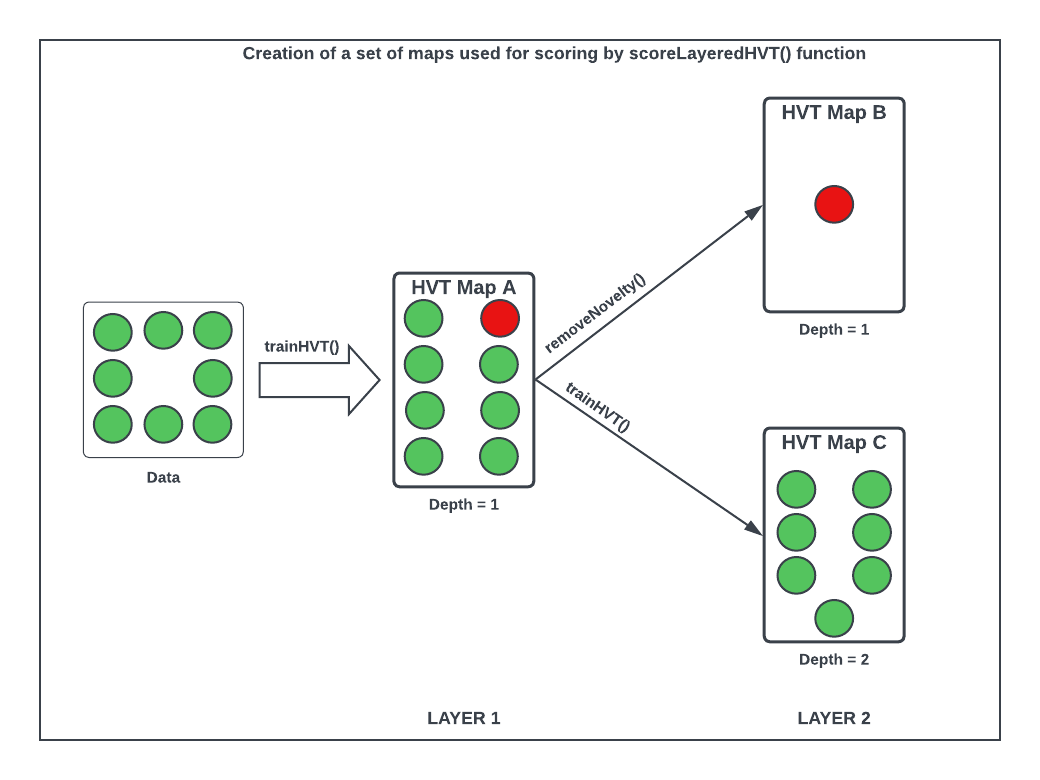
Figure 2: Data Segregation for scoring based on a sequence of maps
using scoreLayeredHVT()
3.1 HVT (v22.12.06)
06th December, 2022
This version of HVT package offers features for both training an HVT
model and eliminating outlier cells from the trained model.
Training or Compression: The initial step
entails training the parent data using the trainHVT
function, specifying the desired compression percentage and quantization
error.
Remove novelty cells: Following the training
process, outlier cells can be identified manually from the 2D hvt plot.
These outlier cells can then be inputted into the
removeNovelty function, which subsequently produces two
datasets in its output: one containing ‘data with novelty’ and the other
containing ‘data without novelty’.
Installation of HVT
(v26.1.3)
CRAN Installation
install.packages("HVT")
Git Hub Installation
library(devtools)
#increase the package download timelimit, if faced with error:
options(timeout = 1200)
devtools::install_github(repo = "Mu-Sigma/HVT")